Apps, protocols, and users on shared blockchains pay gas fees in order to secure the network and ensure it remains decentralized. Gas is the biggest onchain expense for users and apps on shared networks, as well as the primary means of paying a blockchain’s validators.
Bottom line: Gas matters. A lot.
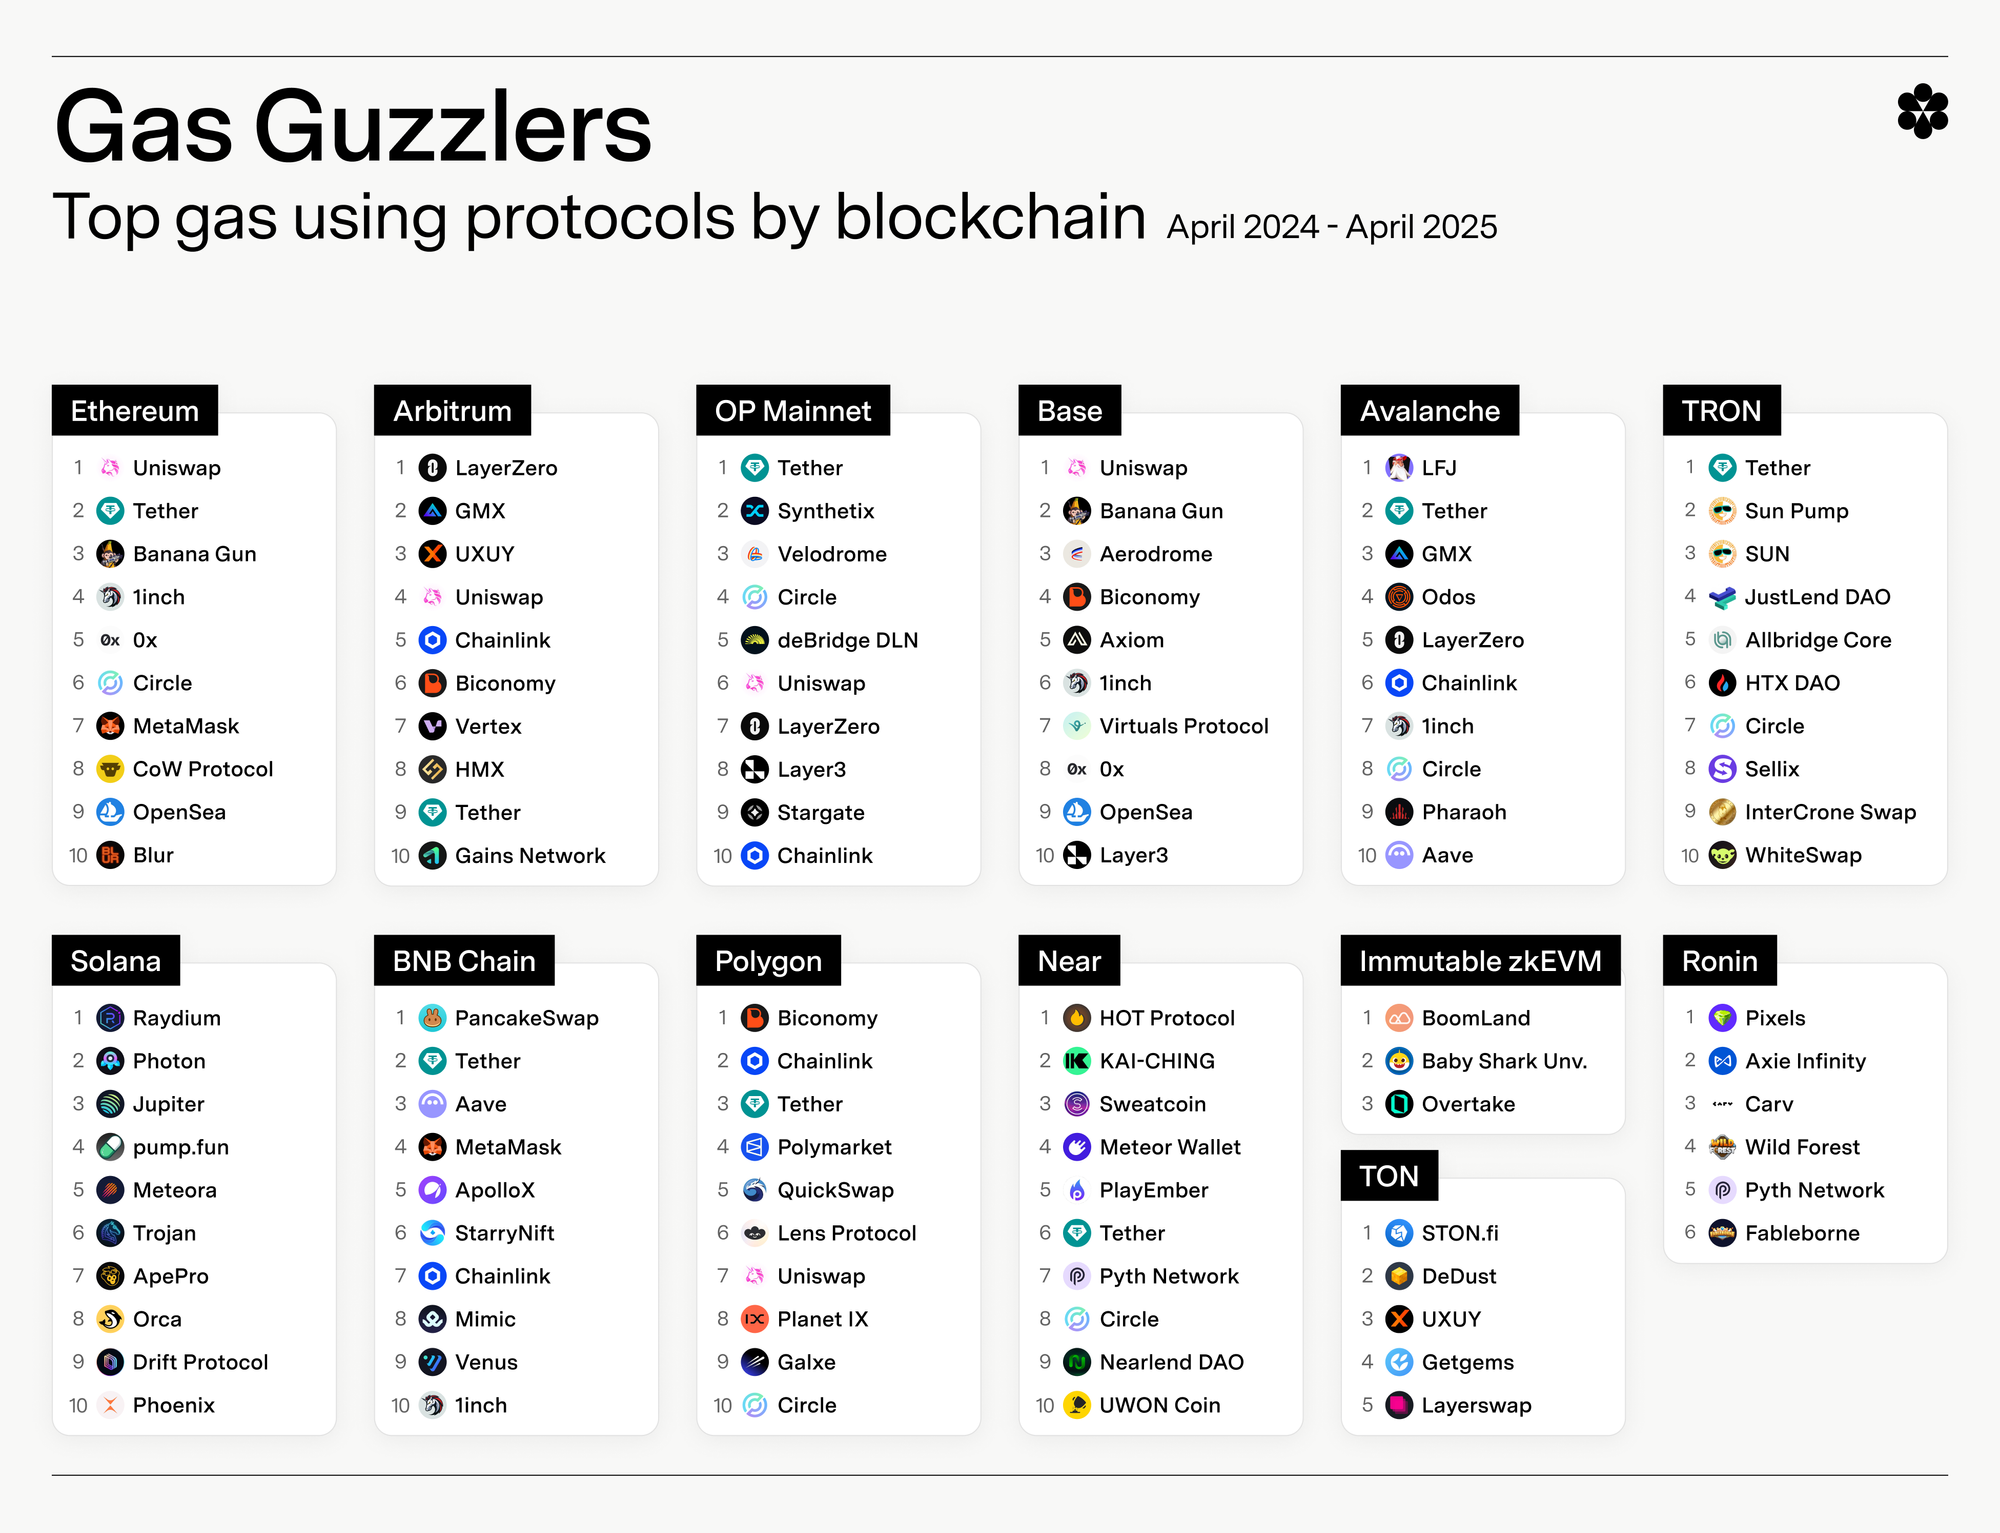
That’s why we’re going to analyze the protocols using the most gas on notable blockchains in this Gas Guzzlers Report. These protocols shape the economic landscape of their host chains, and their high gas usage demonstrates the value they create for users.
While there are similarities, gas usage distribution and patterns vary greatly across blockchains. Analyzing these differences reveals the unique strengths and user bases of each network. Below, we’ll dive deeper into the numbers chain by chain.
Ethereum
Project name
Project category
Cost of gas consumed
Percent of chain's total gas usage
Uniswap
Exchanges (DEX)
$189.8M
31.63%
Tether
Stablecoin issuers
$70.5M
11.75%
Banana Gun
Infrastructure
$60.8M
10.13%
1inch
Exchanges (DEX)
$35.0M
5.83%
0x
Exchanges (DEX)
$27.5M
4.58%
Circle
Stablecoin issuers
$25.1M
4.18%
MetaMask
Exchanges (DEX)
$24.4M
4.07%
CoW Protocol
Exchanges (DEX)
$11.6M
1.93%
OpenSea
NFT marketplaces
$9.0M
1.50%
Blur
NFT marketplaces
$8.3M
1.38%
LI.FI
Infrastructure
$6.7M
1.12%
Pendle
Asset management
$6.5M
1.08%
Aave
Lending
$6.5M
1.08%
EigenLayer
Liquid staking
$6.2M
1.03%
Chainlink
Interoperability
$5.4M
0.90%
ParaSwap
Exchanges (DEX)
$5.1M
0.85%
deBridge
Interoperability
$5.1M
0.85%
Across
Bridges
$4.9M
0.82%
Mimic
Infrastructure
$4.4M
0.73%
Renzo
Liquid staking
$4.1M
0.68%
Ether.fi
Liquid staking
$3.6M
0.60%
LayerZero
Interoperability
$3.5M
0.58%
Lido Finance
Liquid staking
$3.5M
0.58%
KyberSwap
Exchanges (DEX)
$3.4M
0.57%
Ethereum Name Service
Infrastructure
$2.6M
0.43%
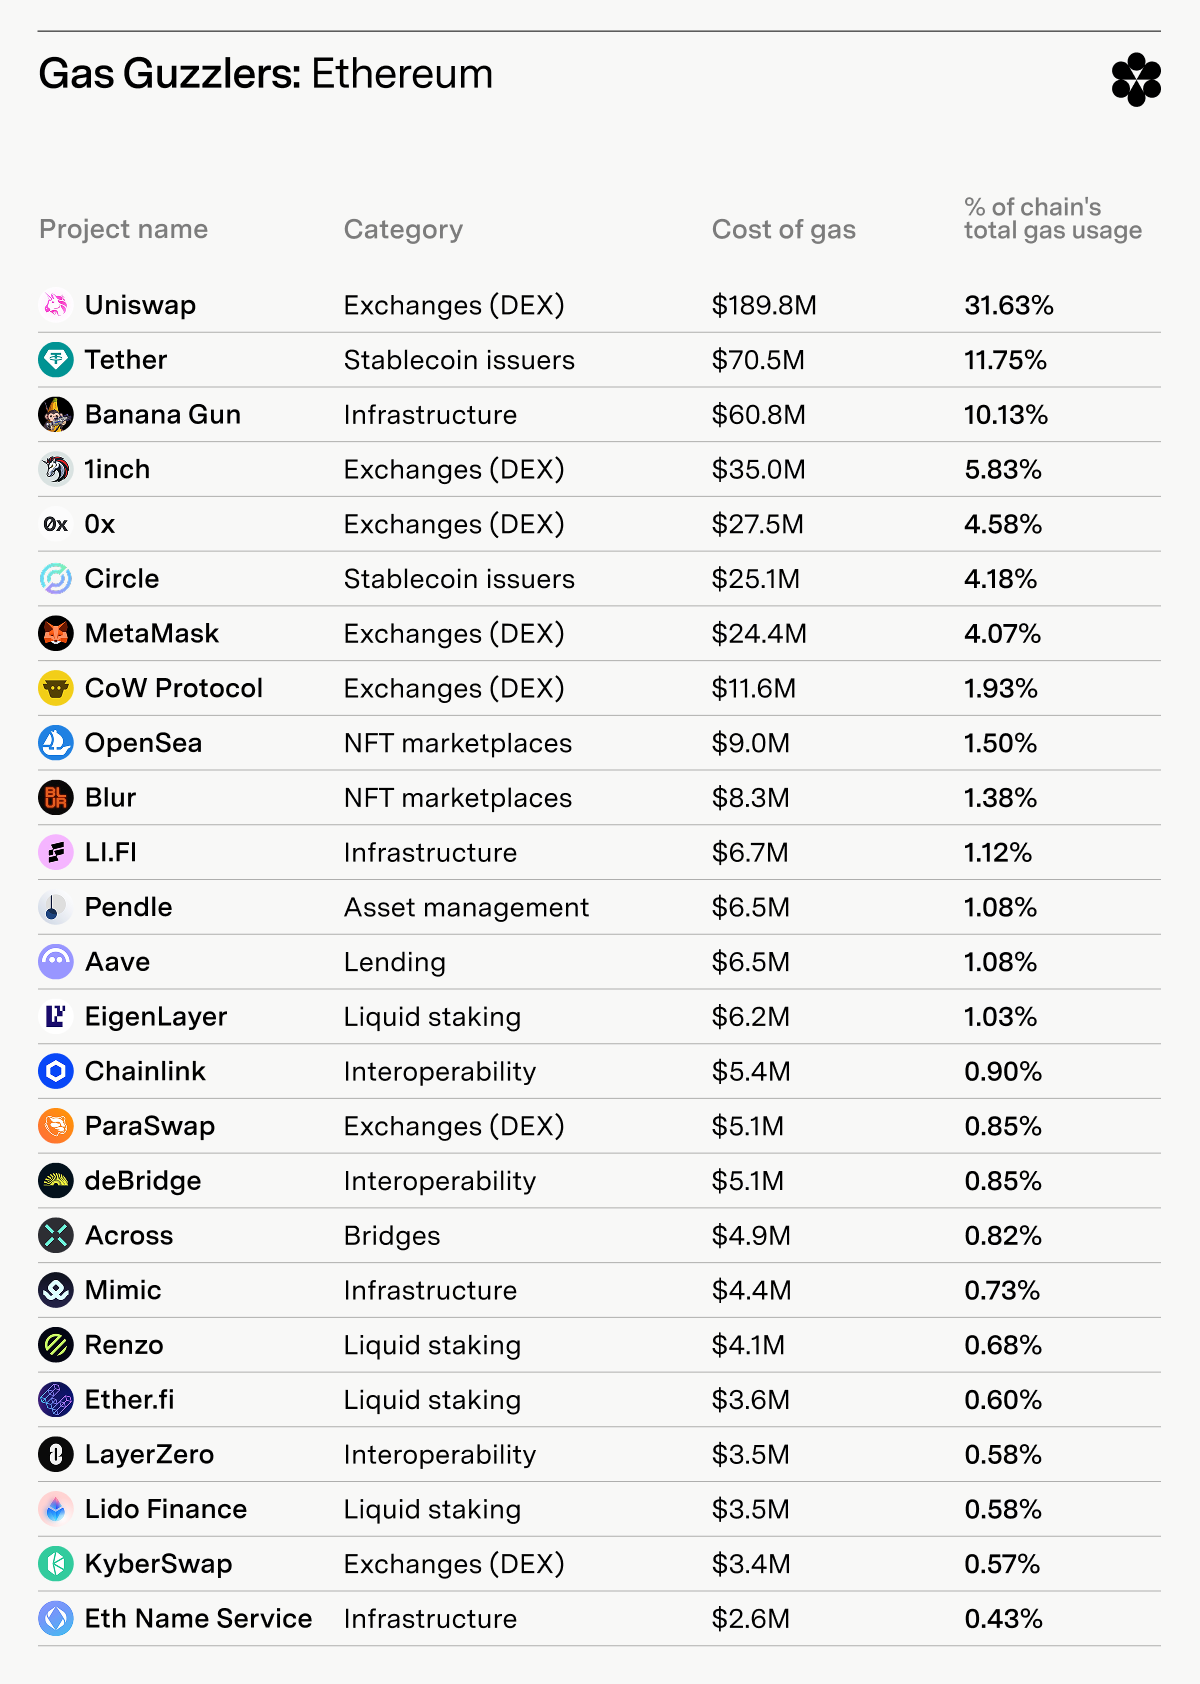
Ethereum’s gas market highlights its diverse ecosystem – unsurprising given that it’s the biggest and most widely used of the programmable blockchains. A few notable findings:
Uniswap leads gas spending at $189.8 million – 31.63% of the blockchain’s total. Tether (11.75%) and BananaGun (10%) are next.
DEX aggregators like 1inch and 0x are significant gas spenders.
Staking protocols and infrastructure providers – especially those focused on interoperability – contribute significantly to the gas market.
As we’ll see, Ethereum’s distribution of gas usage is relatively balanced in comparison to other blockchains.
TRON
Project name
Project category
Cost of gas consumed
Percent of chain's total gas usage
Tether
Stablecoin issuers
$2.3B
95.83%
Sun Pump
$73.3M
3.05%
SUN
Exchanges (DEX)
$22.1M
0.92%
Sun Swap
Exchanges (DEX)
$6.9M
0.29%
JustLend DAO
Lending
$5.6M
0.23%
Allbridge Core
Bridges
$247.0K
0.01%
HTX DAO
$138.0K
0.01%
Circle
Stablecoin issuers
$63.7K
<0.01%
Sellix
Infrastructure
$57.8K
<0.01%
InterCrone Swap
Exchanges (DEX)
$42.4K
<0.01%
WhiteSwap
Exchanges (DEX)
$40.8K
<0.01%
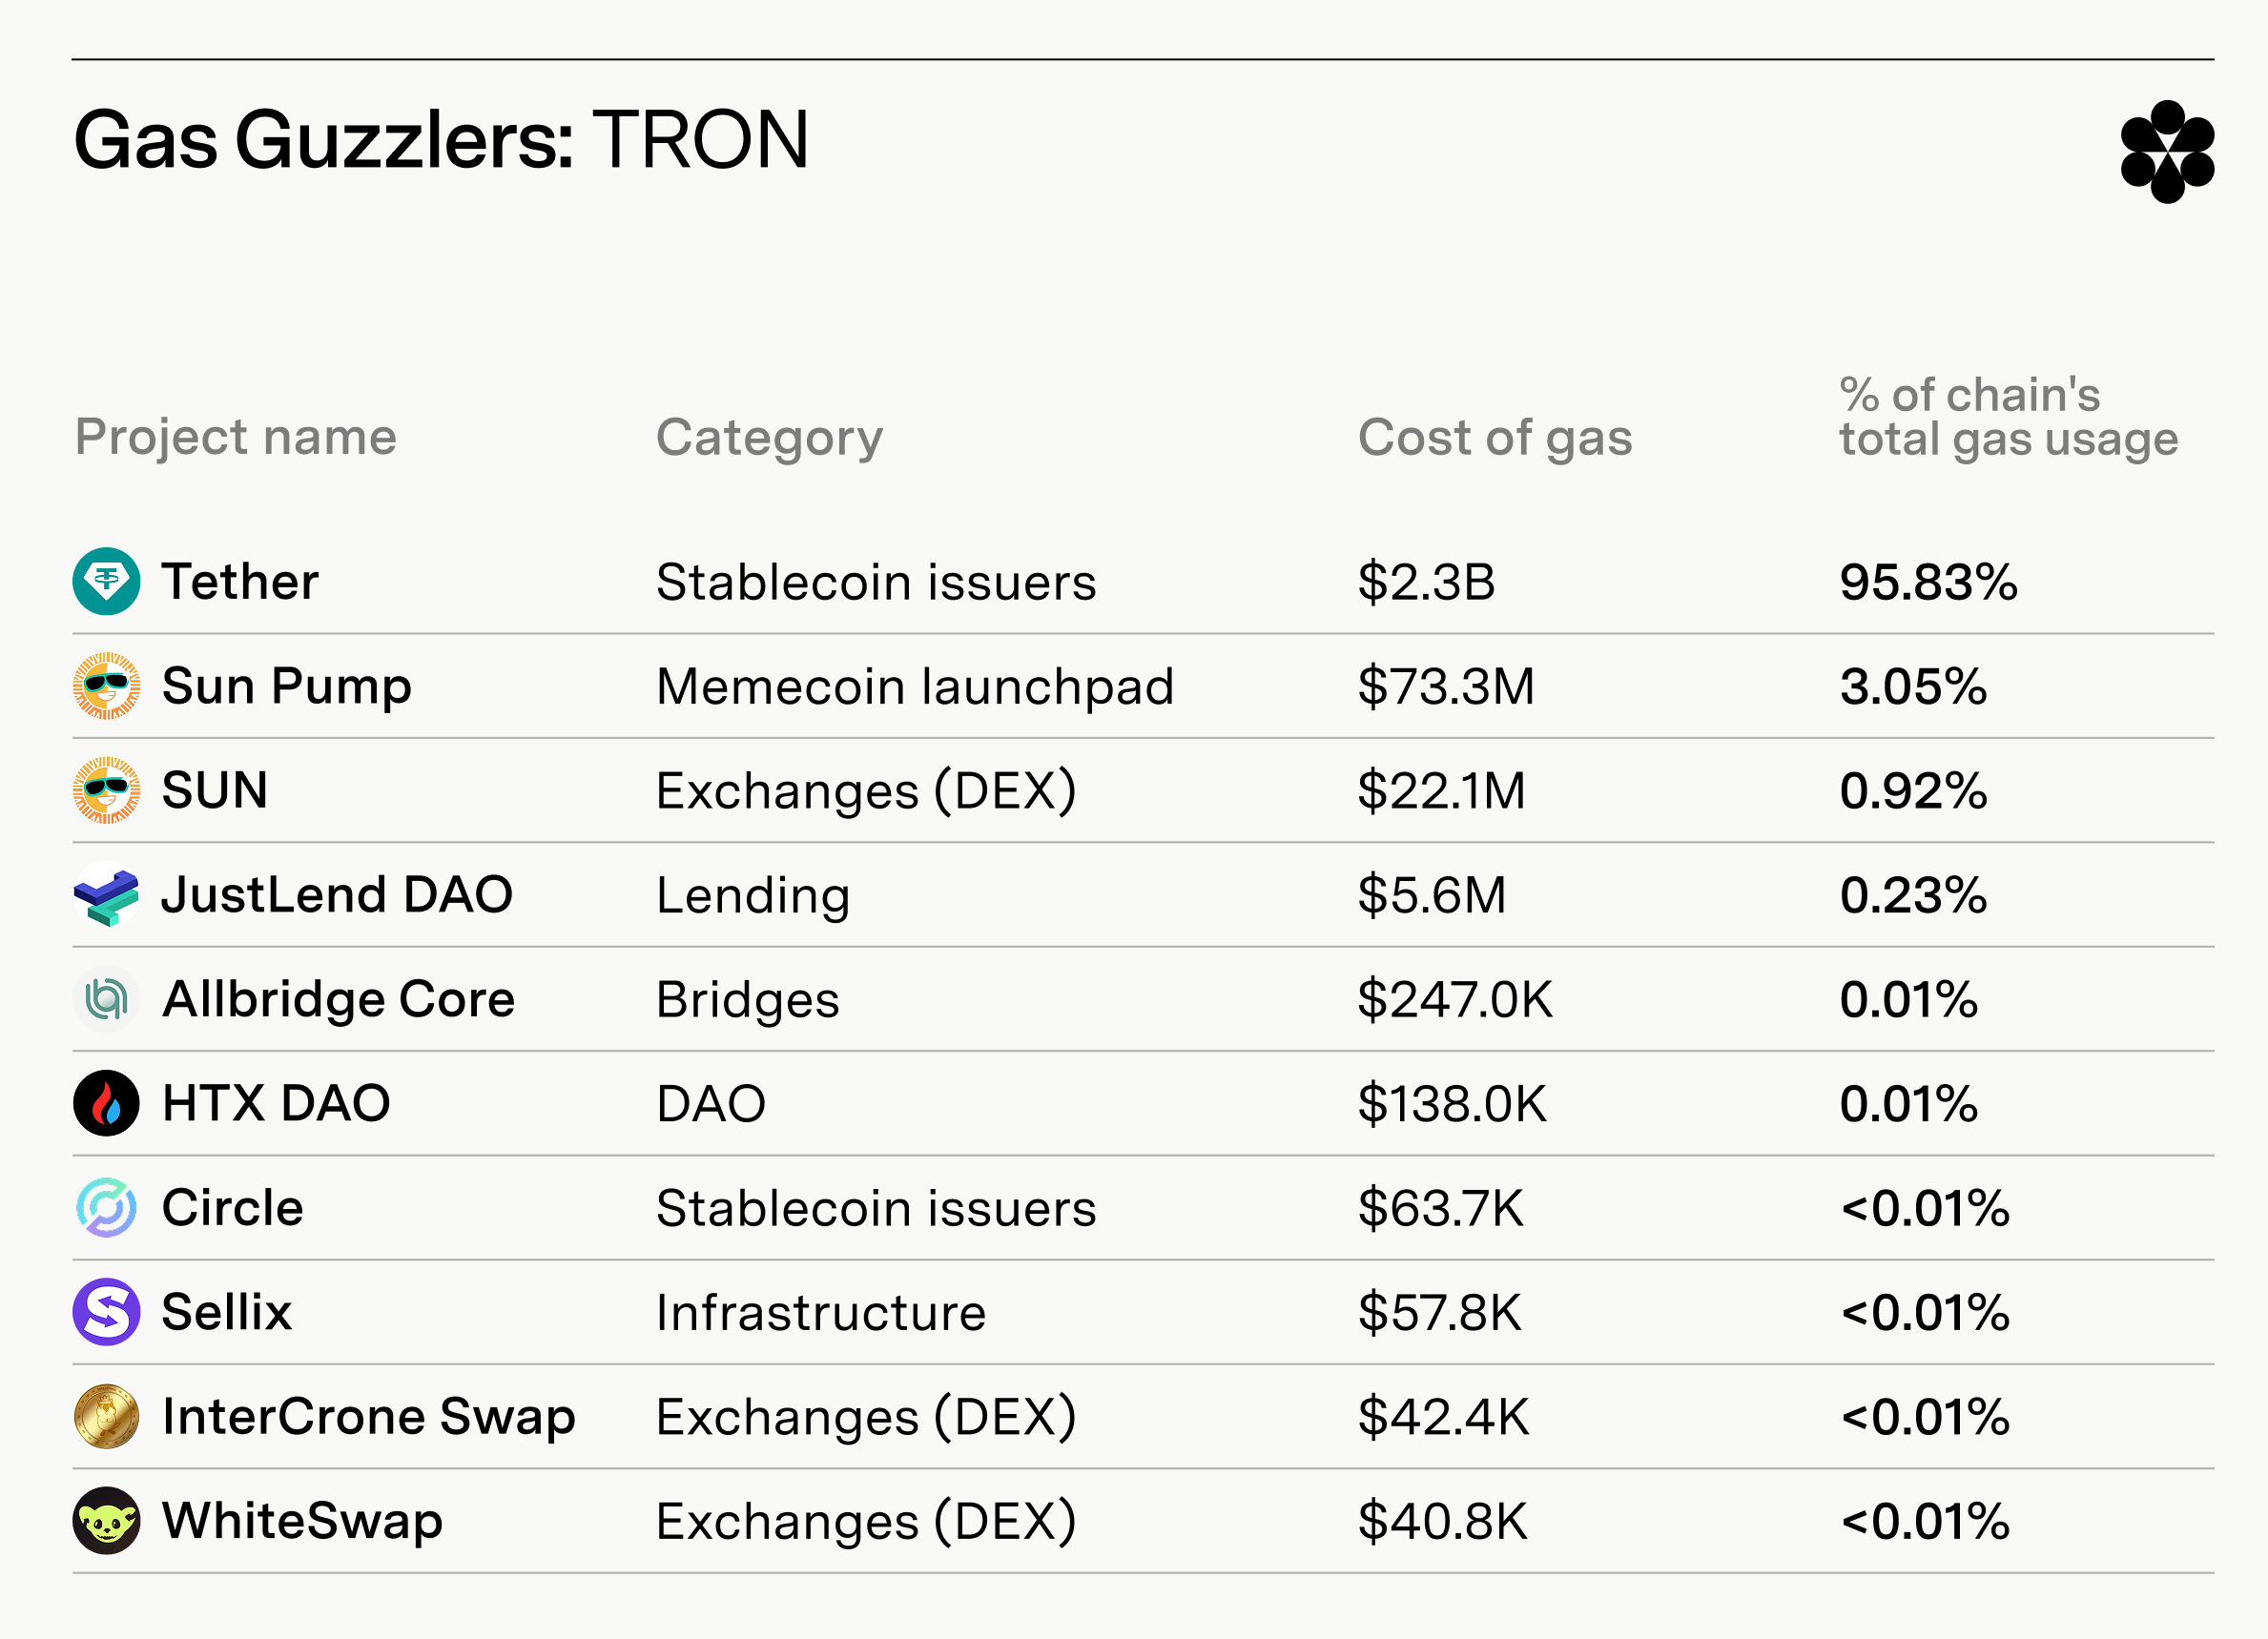
TRON has by far the most concentrated gas market of any blockchain we analyze. Stablecoin issuer Tether accounts for 95.83% of gas usage over the year-long period studied at $2.3 billion spent – a large expense for the most profitable-per-employee company in history. The numbers speak to the strength of the relationship between Tether and TRON, with TRON being the primary chain for USDT issuance.
SUN platform products Sun Swap and Sun Pump, and lending protocol JustLend make up almost all of TRON’s remaining gas market.
OP Mainnet
Project name
Project category
Cost of gas consumed
Percent of chain's total gas usage
Tether
Stablecoin issuers
$337.7K
20.00%
Synthetix
Derivative exchanges
$139.3K
8.20%
Velodrome
Exchanges (DEX)
$130.2K
7.70%
Circle
Stablecoin issuers
$116.5K
6.90%
deBridge DLN
Bridges
$110.2K
6.50%
Uniswap
Exchanges (DEX)
$108.3K
6.40%
LayerZero
Interoperability
$99.7K
5.90%
Layer3
Infrastructure
$63.7K
3.80%
Stargate
Bridges
$53.2K
3.10%
Chainlink
Interoperability
$52.0K
3.10%
LI.FI
Infrastructure
$46.3K
2.70%
Hyperlane
Interoperability
$34.8K
2.10%
Across
Bridges
$33.3K
2.00%
1inch
Exchanges (DEX)
$28.2K
1.70%
Thales
Derivative exchanges
$25.8K
1.50%
Odos
Exchanges (DEX)
$23.4K
1.40%
Extra Finance
Lending
$23.0K
1.40%
deBridge
Interoperability
$21.2K
1.30%
dHedge
Asset management
$19.5K
1.20%
Socket
Infrastructure
$15.2K
0.90%
Superform
Asset management
$14.7K
0.90%
Synapse
Bridges
$14.2K
0.80%
Aperture
Exchanges (DEX)
$12.1K
0.70%
Kwenta
Derivative exchanges
$11.6K
0.70%
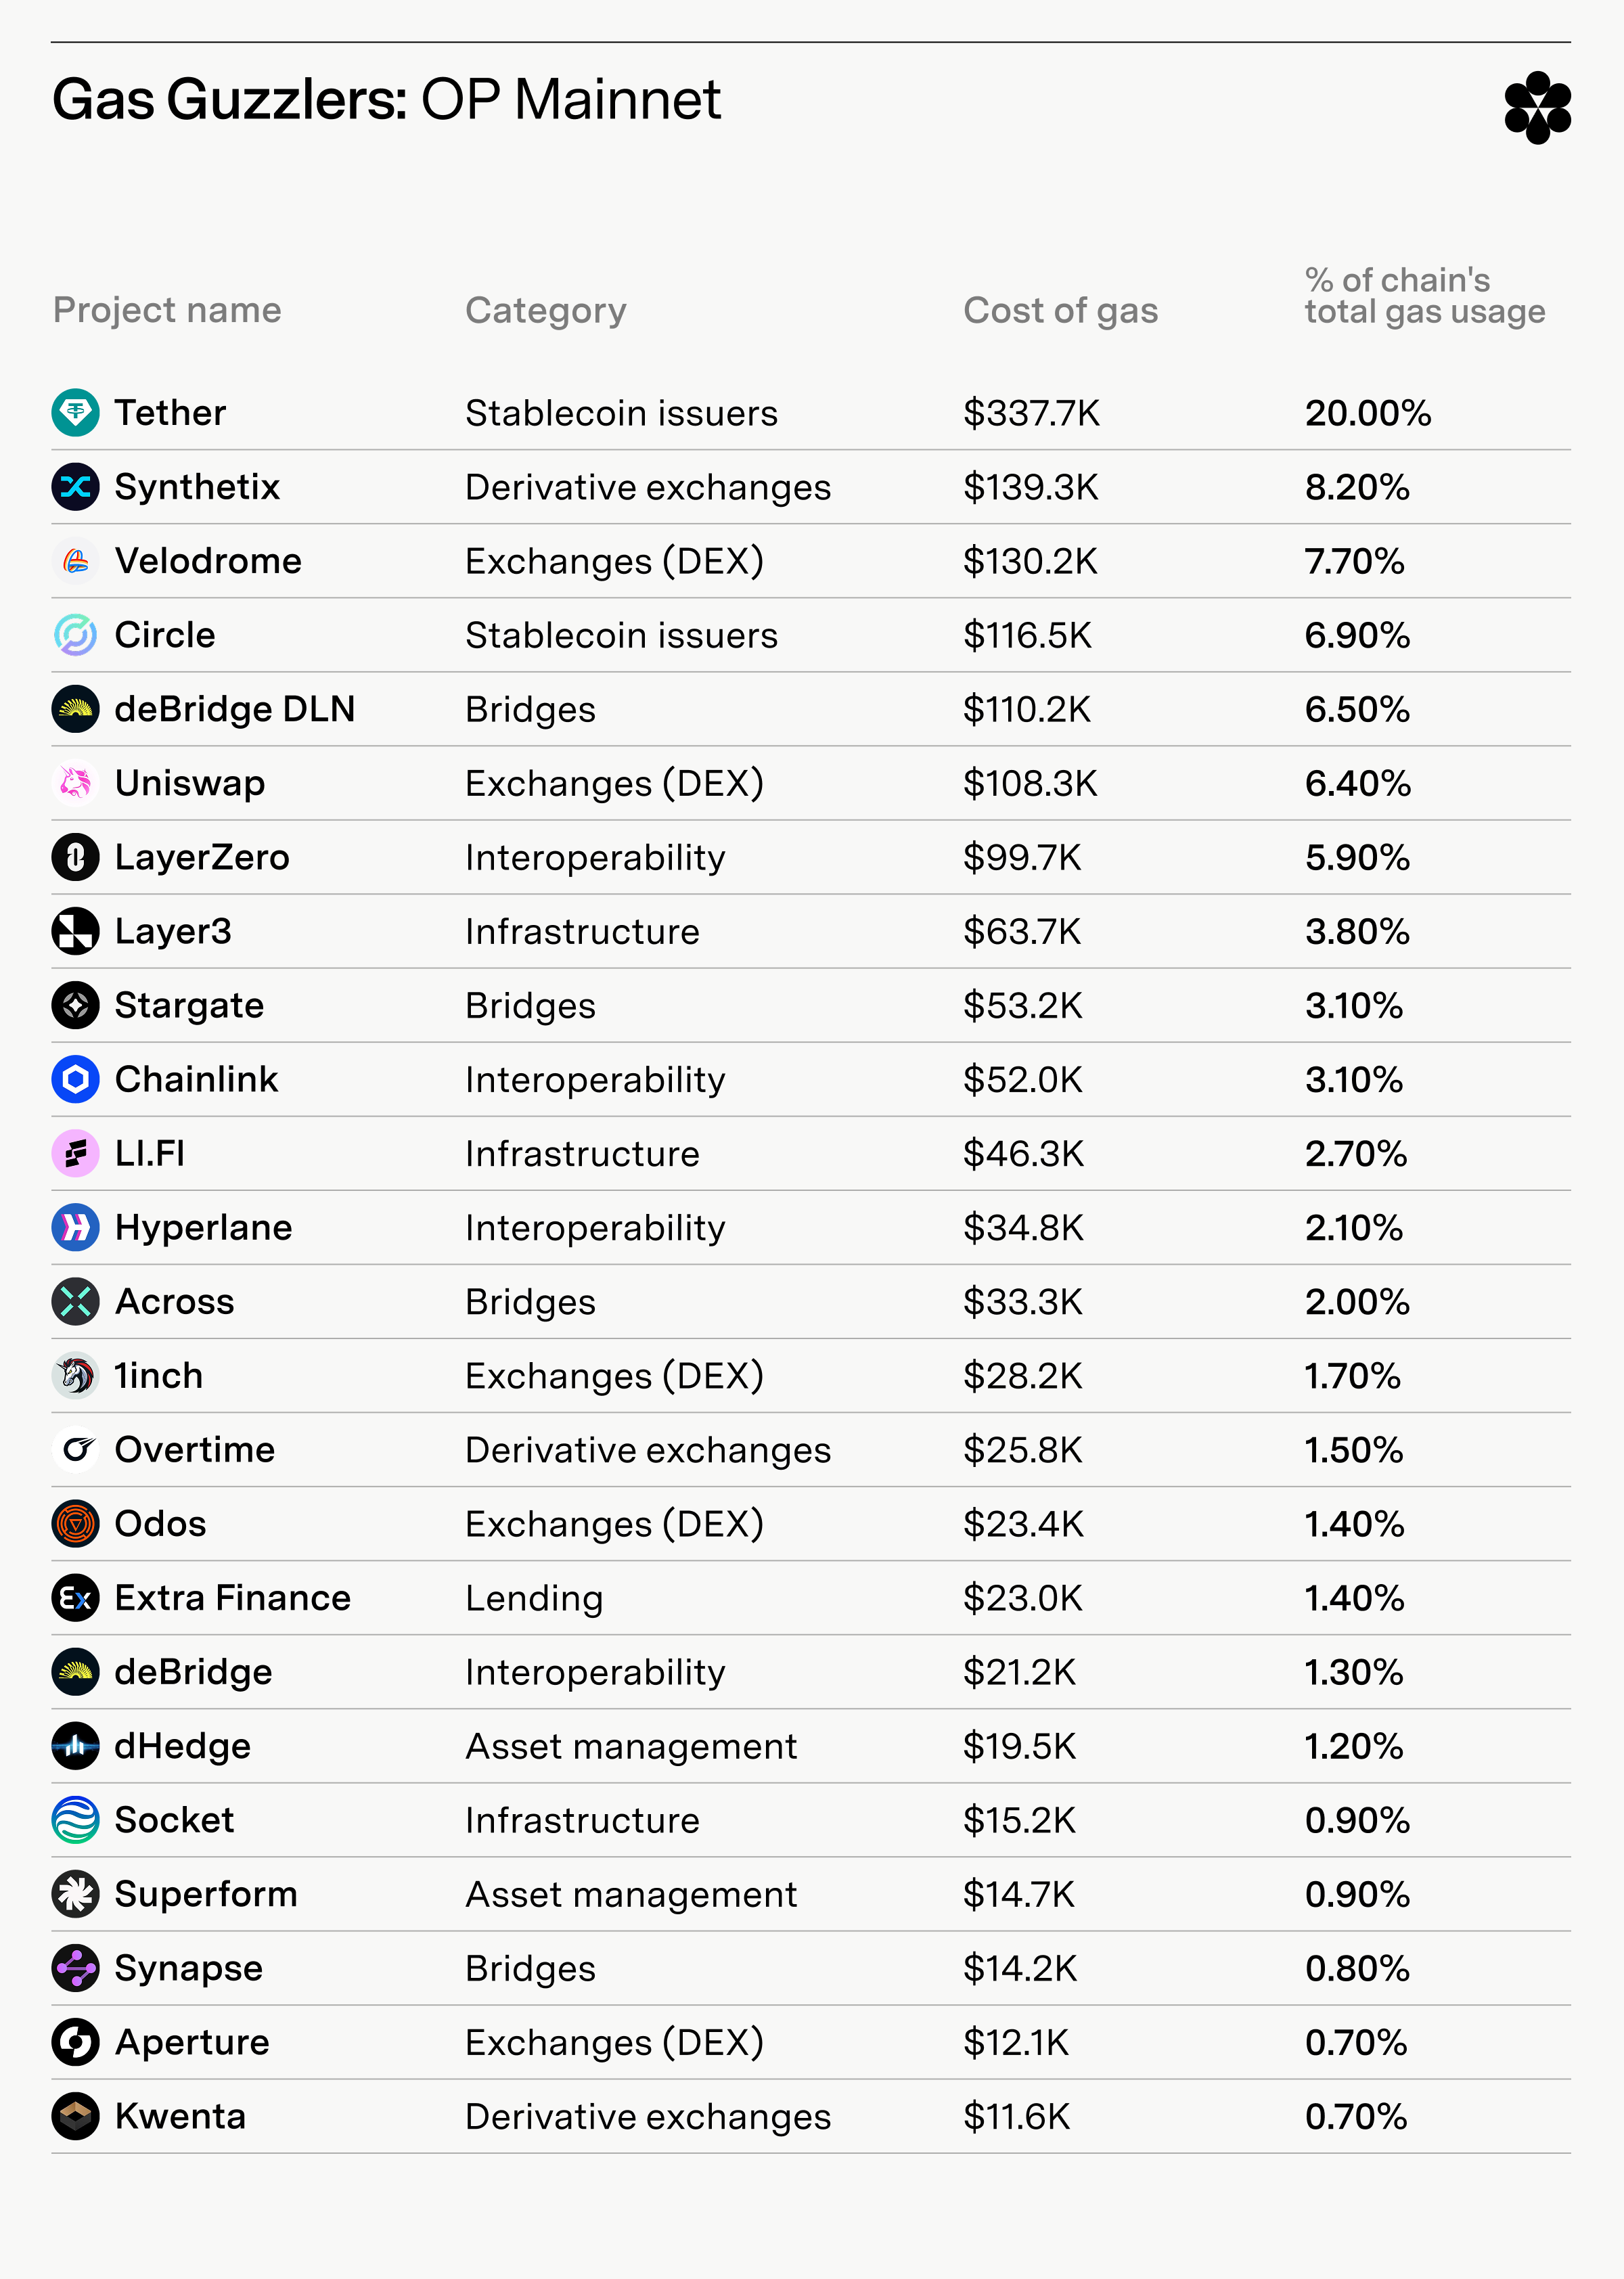
OP Mainnet’s gas usage is more evenly distributed than either Ethereum or TRON.
Tether leads at 20.00% of gas usage, followed by Synthetix at 8.20% and Optimism-focused DEX Velodrome at 7.70%.
Circle is fourth at 6.90%, making OP Mainnet the chain the USDC issuer ranks highest on in relative gas usage.
Many protocols sit between 1% and 7% of overall gas usage. DEXs like Uniswap, 1inch, Odos, and Aperture lead in DeFi, while infra providers across several categories contribute significantly.
The healthy mix of protocols speaks to OP Mainnet’s strength as a general purpose chain.
Arbitrum
Project name
Project category
Cost of gas consumed
Percent of chain's total gas usage
LayerZero
Interoperability
$2.5M
26.04%
GMX
Derivative exchanges
$1.1M
11.46%
UXUY
Exchanges (DEX)
$584.5K
6.09%
Uniswap
Exchanges (DEX)
$574.3K
5.98%
Chainlink
Interoperability
$459.9K
4.79%
Biconomy
Infrastructure
$420.6K
4.38%
Vertex
Derivative exchanges
$403.5K
4.20%
HMX
Derivative exchanges
$383.0K
3.99%
Tether
Stablecoin issuers
$244.6K
2.55%
Gains Network
Derivative exchanges
$238.8K
2.49%
Circle
Stablecoin issuers
$227.1K
2.37%
Odos
Exchanges (DEX)
$198.4K
2.07%
1inch
Exchanges (DEX)
$178.1K
1.85%
LI.FI
Infrastructure
$131.7K
1.37%
Camelot
Exchanges (DEX)
$117.4K
1.22%
Aave
Lending
$117.2K
1.22%
DeFi Saver
Infrastructure
$107.8K
1.12%
Stargate
Bridges
$104.7K
1.09%
UXLINK
Social
$72.6K
0.76%
PancakeSwap
Exchanges (DEX)
$63.7K
0.66%
KyberSwap
Exchanges (DEX)
$58.2K
0.61%
LFJ
Exchanges (DEX)
$57.4K
0.60%
Dolomite
Lending
$56.0K
0.58%
Aperture
Exchanges (DEX)
$54.6K
0.57%
ParaSwap
Exchanges (DEX)
$53.6K
0.56%
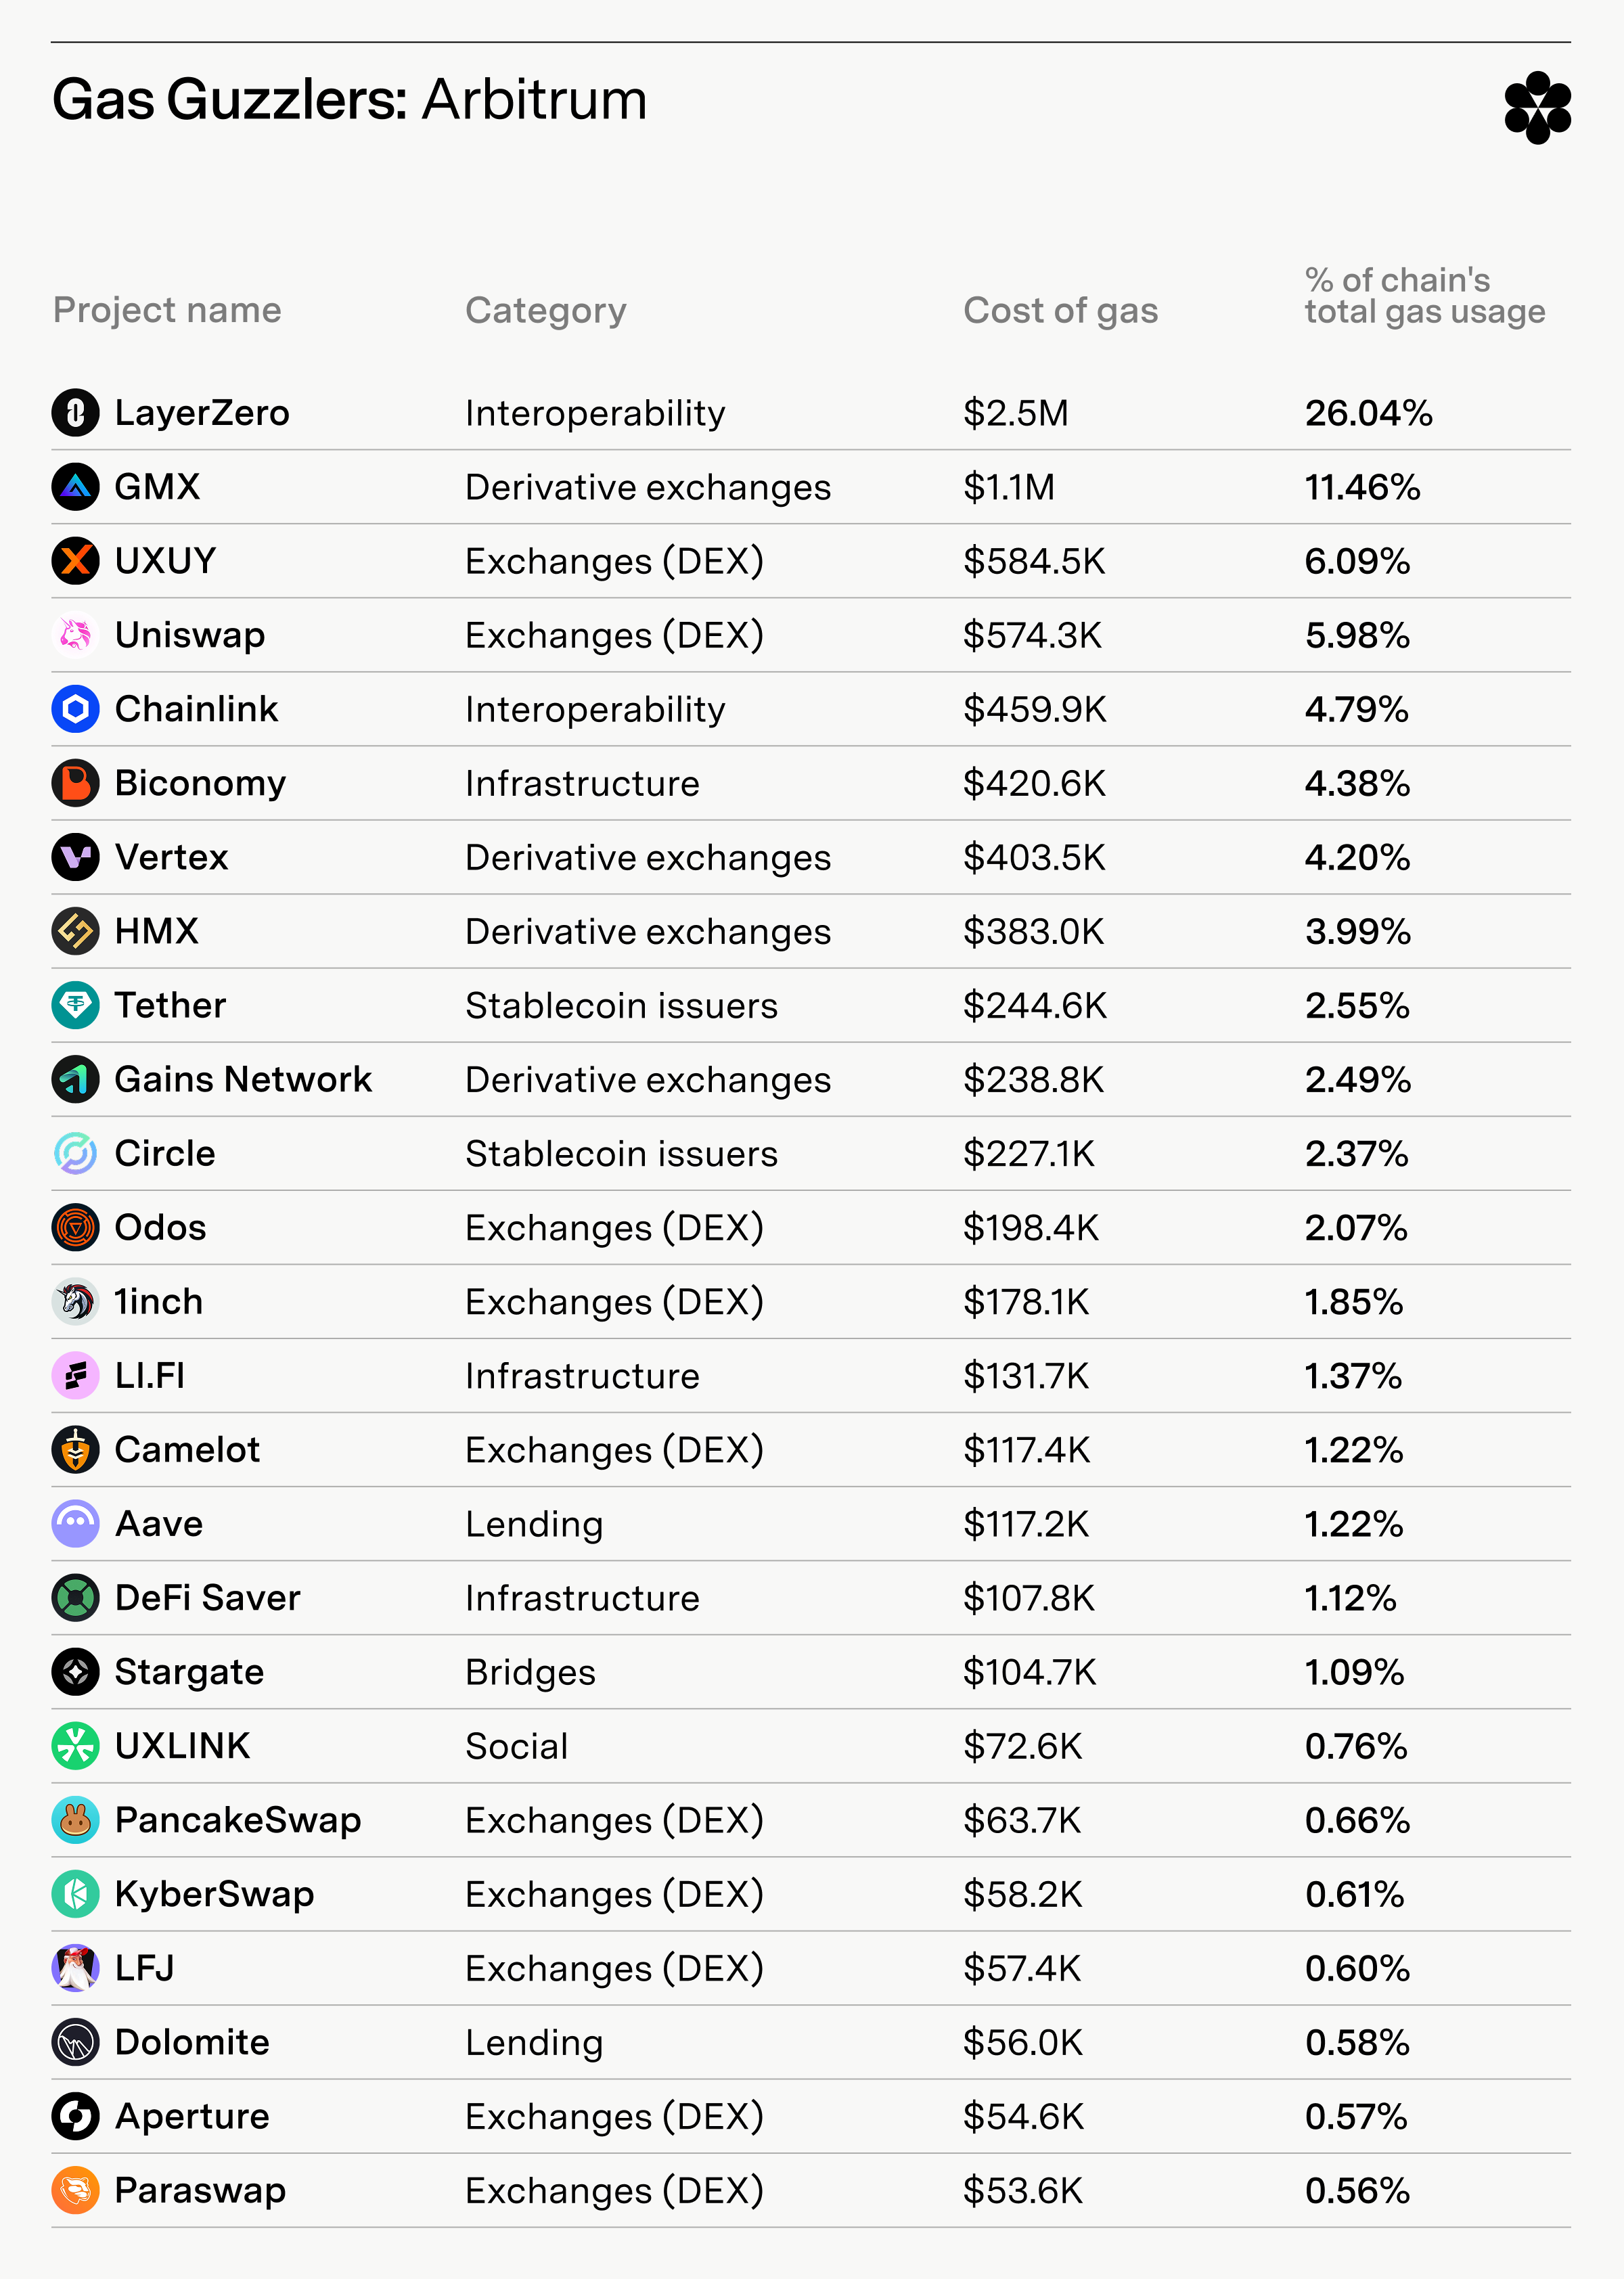
Arbitrum also sees evenly distributed gas usage, but with interoperability providers taking on a bigger role.
LayerZero leads at 26.04% of gas usage, followed by GMX (11.46%) and UXUY (6.09%).
Derivatives exchanges take on a big role. In addition to GMX, we see Vertex, HMX, and Gains Network driving significant gas spending.
Onchain social platform UXLINK stands out as a non-finance protocol spending heavily on gas.
Similar to OP Mainnet, Arbitrum gas usage is driven by a diverse array of apps, with DEXs driving most end user activity.
Base
Project name
Project category
Cost of gas consumed
Percent of chain's total gas usage
Uniswap
Exchanges (DEX)
$4.4M
30.56%
Banana Gun
Infrastructure
$2.5M
17.36%
Aerodrome
Exchanges (DEX)
$1.1M
7.64%
Biconomy
Infrastructure
$1.1M
7.64%
Axiom
Infrastructure
$840.3K
5.83%
1inch
Exchanges (DEX)
$316.0K
2.19%
Virtuals Protocol
Infrastructure
$299.3K
2.08%
0x
Exchanges (DEX)
$284.9K
1.98%
OpenSea
NFT marketplaces
$280.7K
1.95%
Layer3
Infrastructure
$259.4K
1.80%
Odos
Exchanges (DEX)
$224.2K
1.56%
Circle
Stablecoin issuers
$217.4K
1.51%
friend.tech
Social
$195.0K
1.35%
deBridge DLN
Bridges
$182.4K
1.27%
KyberSwap
Exchanges (DEX)
$177.4K
1.23%
LayerZero
Interoperability
$132.6K
0.92%
SushiSwap
Exchanges (DEX)
$103.0K
0.72%
deBridge
Interoperability
$100.3K
0.70%
Fren Pet
Gaming
$98.1K
0.68%
LI.FI
Infrastructure
$97.2K
0.67%
Across
Bridges
$95.4K
0.66%
Stargate
Bridges
$90.6K
0.63%
PancakeSwap
Exchanges (DEX)
$87.5K
0.61%
vfat.io
Asset management
$79.9K
0.55%
Extra Finance
Lending
$71.9K
0.50%
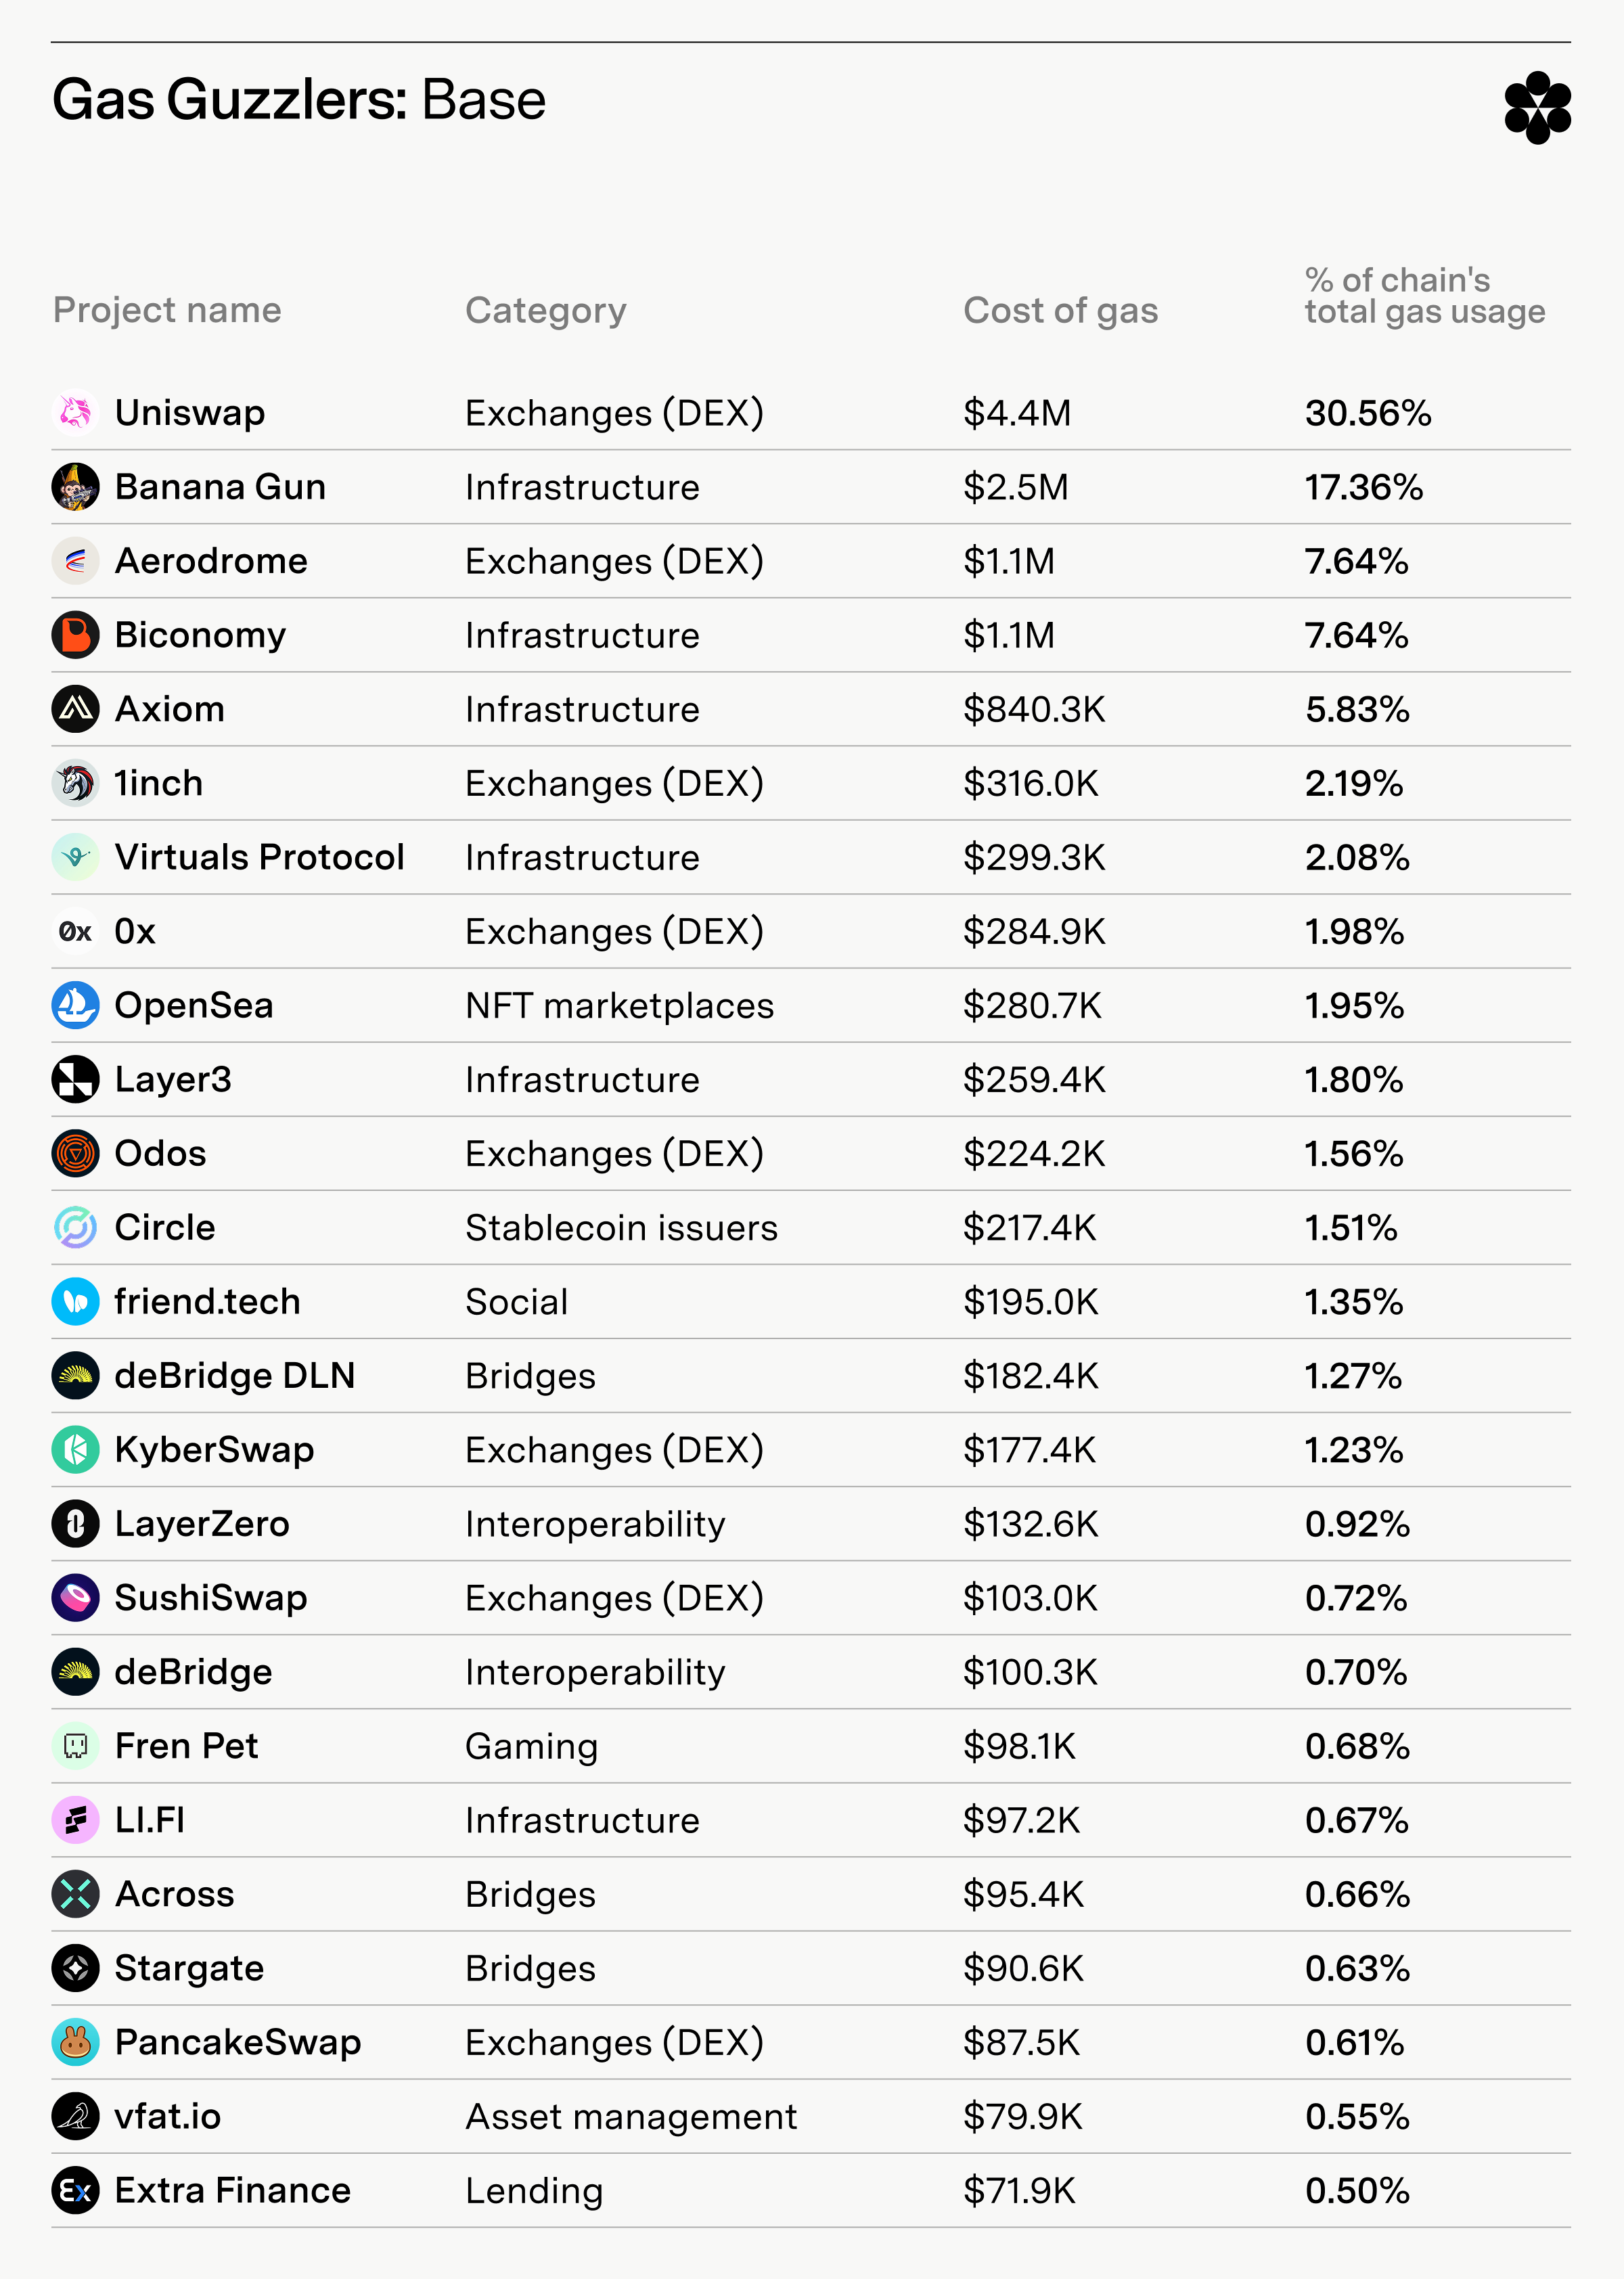
Base sees higher concentration than other general-purpose chains, more in line with Ethereum’s.
Uniswap leads gas spending at 30.56% of the total, followed by Banana Gun (17.36%) and Aerodrome (7.64%).
Whereas the biggest DEXs on OP Mainnet and Arbitrum were built targeting those chains specifically, Base’s leading DEX Uniswap is also widely used on many other chains.
Onchain game Fren Pet stands out as a non-finance protocol spending significantly on gas.
Base’s range of protocols highlights its status as a leading L2 on Ethereum.
Solana
Project name
Project category
Cost of gas consumed
Percent of chain's total gas usage
Raydium
Exchanges (DEX)
$145.5M
41.81%
Photon
Derivative exchanges
$70.7M
20.32%
Jupiter
Exchanges (DEX)
$64.4M
18.51%
PumpFun
Exchanges (DEX)
$45.5M
13.07%
Meteora
Exchanges (DEX)
$7.7M
2.21%
Trojan
Infrastructure
$6.3M
1.81%
ApePro
Exchanges (DEX)
$3.3M
0.95%
Orca
Exchanges (DEX)
$1.5M
0.43%
Drift Protocol
Derivative exchanges
$855.5K
0.25%
Phoenix
Exchanges (DEX)
$821.1K
0.24%
Chainlink
Interoperability
$510.2K
0.15%
Lifinity
Exchanges (DEX)
$195.4K
0.06%
Openbook
Exchanges (DEX)
$171.6K
0.05%
Wormhole
Interoperability
$114.3K
0.03%
Metaplex
NFT marketplaces
$114.0K
0.03%
Helium
Infrastructure
$98.0K
0.03%
Jito
Liquid staking
$61.3K
0.02%
Save (fka Solend)
Lending
$48.4K
0.01%
Fluxbeam
Exchanges (DEX)
$40.2K
0.01%
marginfi
Lending
$26.6K
0.01%
Star Atlas
Gaming
$23.3K
0.01%
Stabble
Exchanges (DEX)
$15.0K
<0.01%
Marinade
Liquid staking
$9.8K
<0.01%
Pyth Network
Oracles
$8.7K
<0.01%
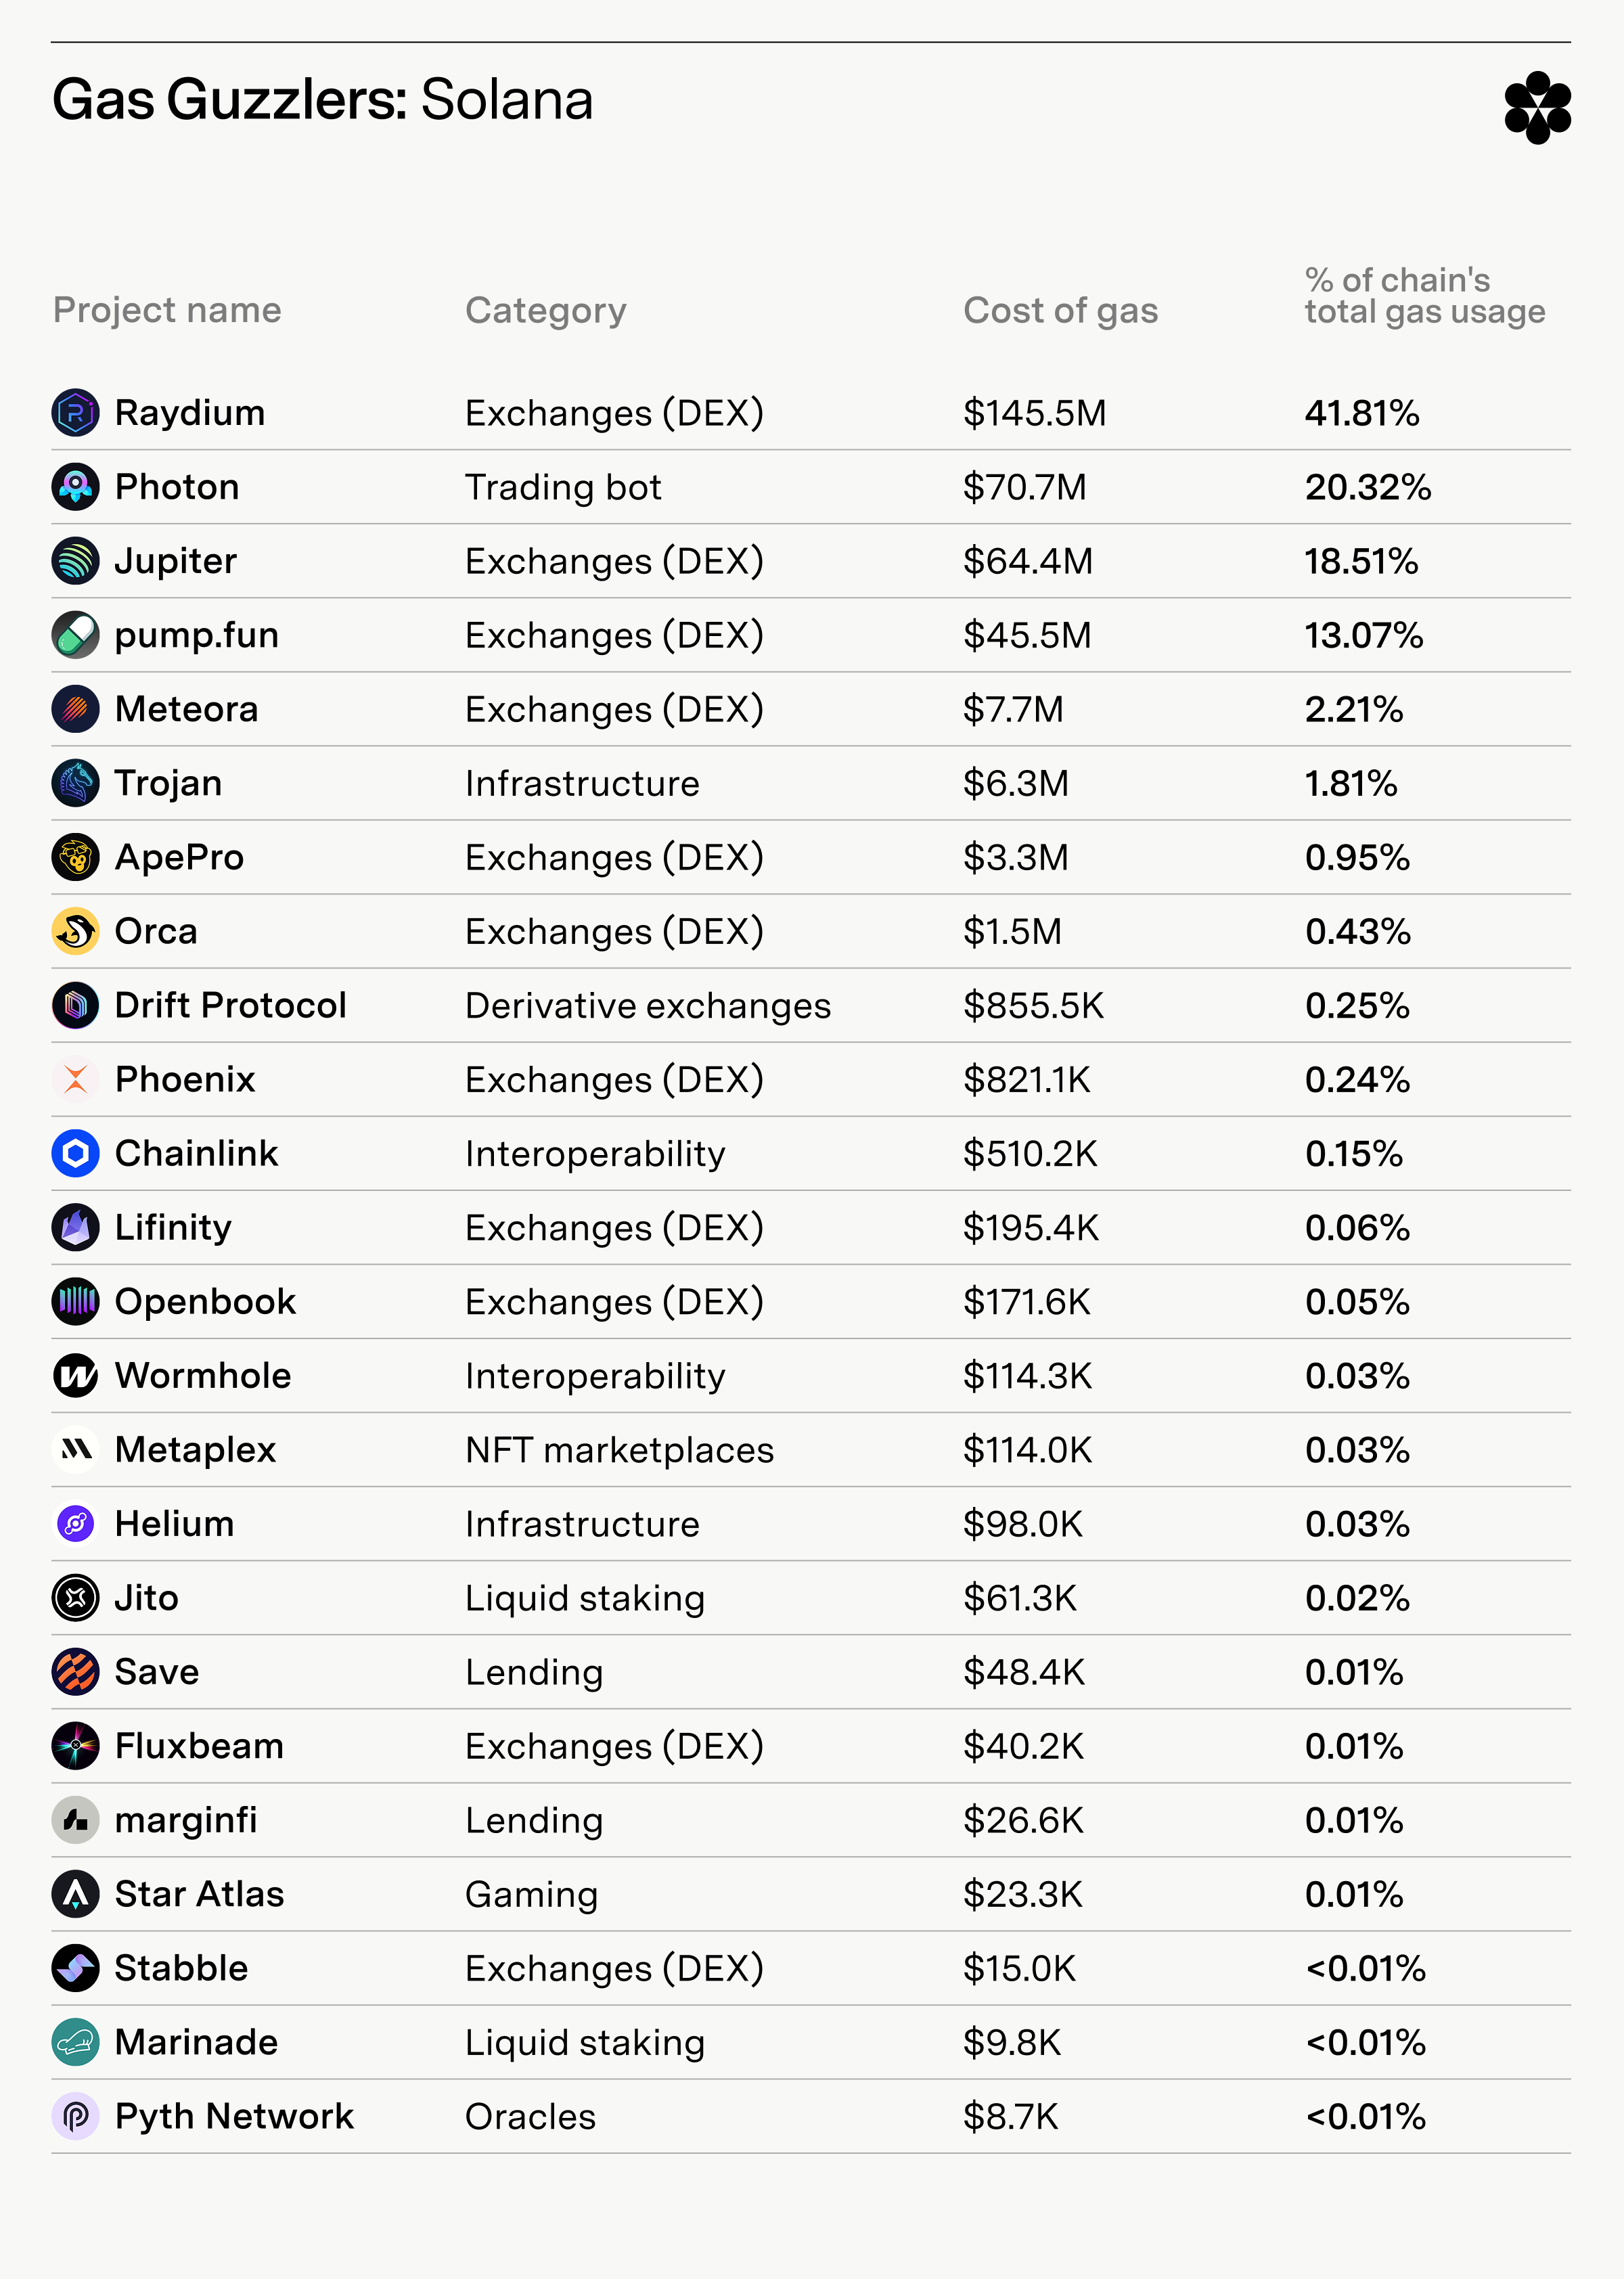
As any crypto observer would expect, protocols related to token trading dominate Solana gas usage.
Raydium consumes 41.81% of Solana’s gas, followed by token sniper bot Photon (20.32%) and Jupiter (18.51%).
The notorious memecoin factory PumpFun is fourth at 13.07%, and is likely driving much of the gas spending on the three protocols above it.
Gas usage drops off significantly after the top four protocols.
Overall, Solana’s gas market is relatively concentrated to top trading protocols, especially those associated with memecoins.
BNB Chain
Project name
Project category
Cost of gas consumed
Percent of chain's total gas usage
PancakeSwap
Exchanges (DEX)
$18.1M
43.99%
Tether
Stablecoin issuers
$12.5M
30.37%
Aave
Lending
$1.5M
3.65%
MetaMask
Exchanges (DEX)
$1.3M
3.16%
ApolloX
Derivative exchanges
$587.3K
1.43%
StarryNift
Gaming
$577.1K
1.40%
Chainlink
Interoperability
$485.2K
1.18%
Mimic
Infrastructure
$467.5K
1.14%
Venus
Lending
$415.7K
1.01%
1inch
Exchanges (DEX)
$415.7K
1.01%
Solv Protocol
Liquid staking
$401.9K
0.98%
LI.FI
Infrastructure
$393.7K
0.96%
Aperture
Exchanges (DEX)
$363.0K
0.88%
Biconomy
Infrastructure
$360.0K
0.87%
KyberSwap
Exchanges (DEX)
$330.2K
0.80%
deBridge
Interoperability
$329.5K
0.80%
Odos
Exchanges (DEX)
$228.2K
0.55%
Galxe
Infrastructure
$181.6K
0.44%
Uniswap
Exchanges (DEX)
$169.7K
0.41%
LayerZero
Interoperability
$164.4K
0.40%
QuestN
Infrastructure
$158.5K
0.39%
0x
Exchanges (DEX)
$157.3K
0.38%
Stargate
Bridges
$120.0K
0.29%
Thena
Exchanges (DEX)
$105.7K
0.26%
KiloEx
Derivative exchanges
$103.7K
0.25%
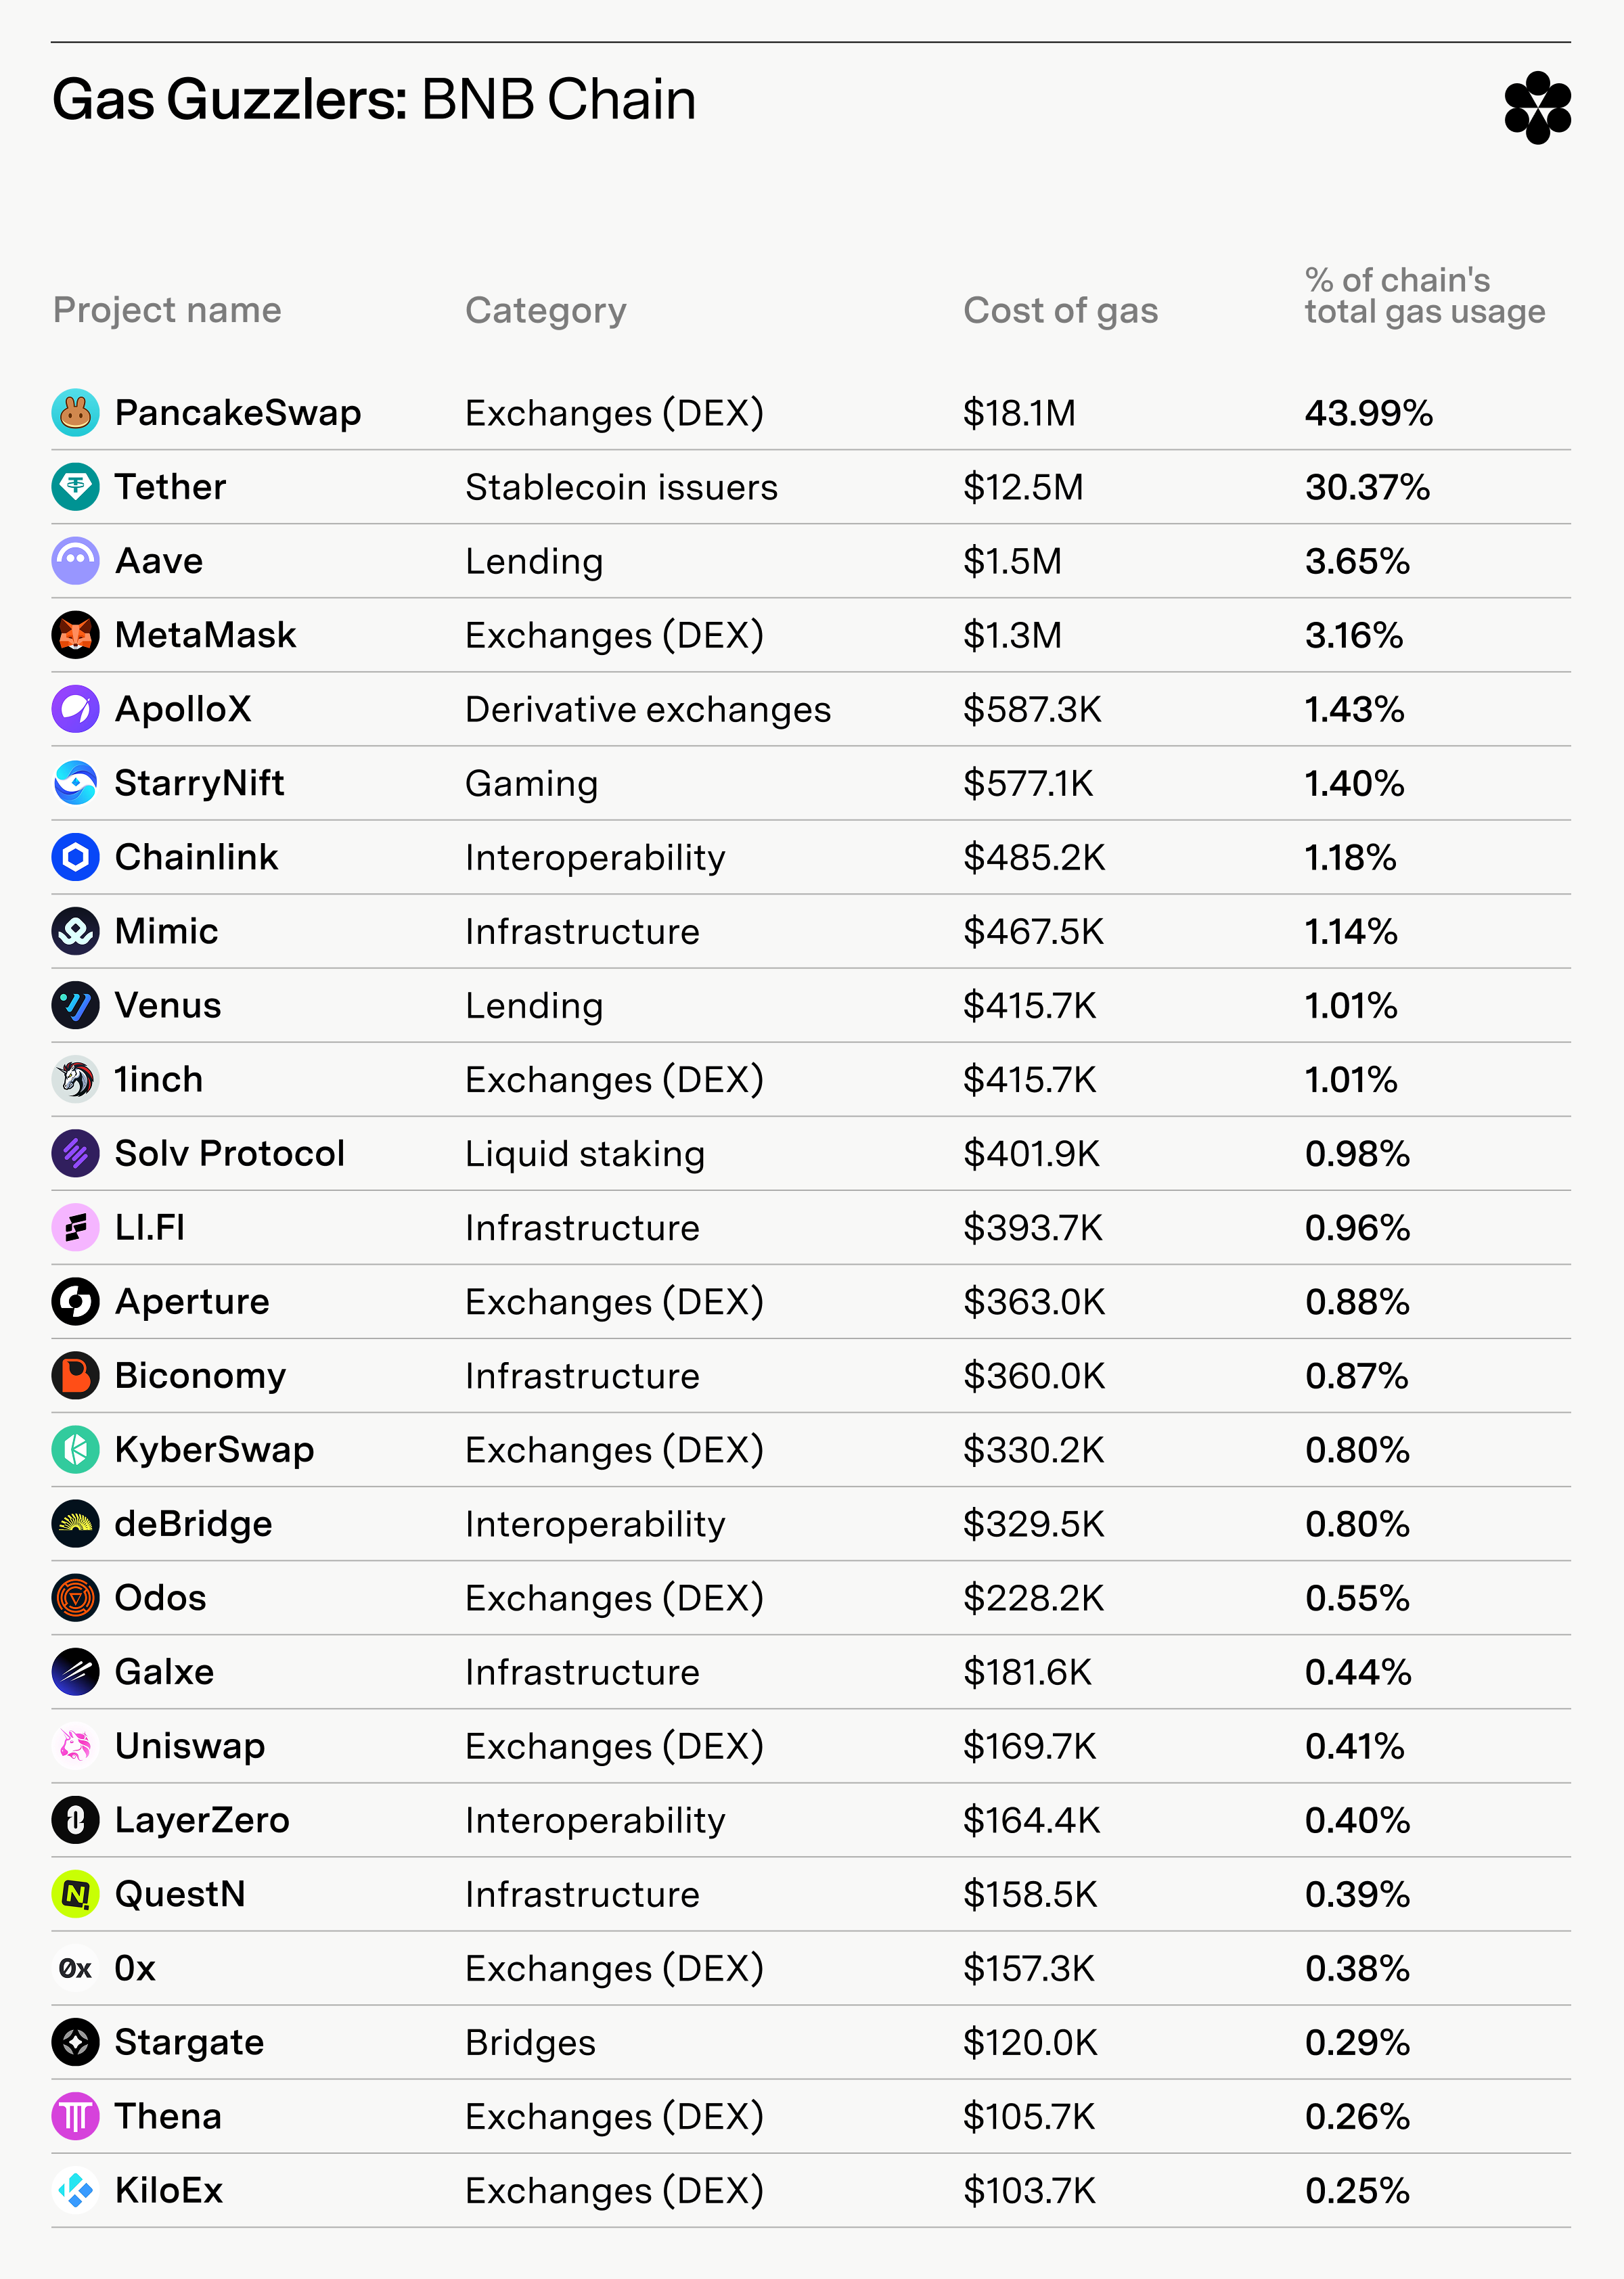
BNB Chain’s gas usage highlights its large DeFi ecosystem, though the top two protocols lead by a wide margin.
PancakeSwap is number one at 43.99% of gas usage, followed by Tether (30.37%) and Aave (3.65%).
Notably, no lending protocol ranks higher for relative gas consumption on any other chain than Aave on BNB Chain.
StarryNift ranks sixth at 1.40% of gas usage, the highest rank for an onchain game on any general purpose chain.
While BNB Chain’s gas market is relatively concentrated to its top two gas guzzlers, the ecosystem is big enough that other protocols are still spending significantly in raw dollar terms.
Avalanche
Project name
Project category
Cost of gas consumed
Percent of chain's total gas usage
LFJ
Exchanges (DEX)
$516.8K
16.15%
Tether
Stablecoin issuers
$432.1K
13.50%
GMX
Derivative exchanges
$333.3K
10.42%
Odos
Exchanges (DEX)
$218.7K
6.83%
LayerZero
Interoperability
$185.4K
5.79%
Chainlink
Interoperability
$179.6K
5.61%
1inch
Exchanges (DEX)
$150.4K
4.70%
Circle
Stablecoin issuers
$126.3K
3.95%
Pharaoh
Exchanges (DEX)
$111.2K
3.48%
Aave
Lending
$97.5K
3.05%
MetaMask
Exchanges (DEX)
$94.0K
2.94%
The Arena
Social
$76.2K
2.38%
Stargate
Bridges
$69.9K
2.18%
BENQI
Lending
$56.7K
1.77%
Uniswap
Exchanges (DEX)
$55.2K
1.73%
LI.FI
Infrastructure
$54.8K
1.71%
Biconomy
Infrastructure
$44.7K
1.40%
Pangolin
Exchanges (DEX)
$41.7K
1.30%
deBridge
Interoperability
$39.7K
1.24%
ParaSwap
Exchanges (DEX)
$34.5K
1.08%
KyberSwap
Exchanges (DEX)
$27.3K
0.85%
Hyperlane
Interoperability
$19.1K
0.60%
Merkly
Bridges
$18.5K
0.58%
Squid
Infrastructure
$16.0K
0.50%
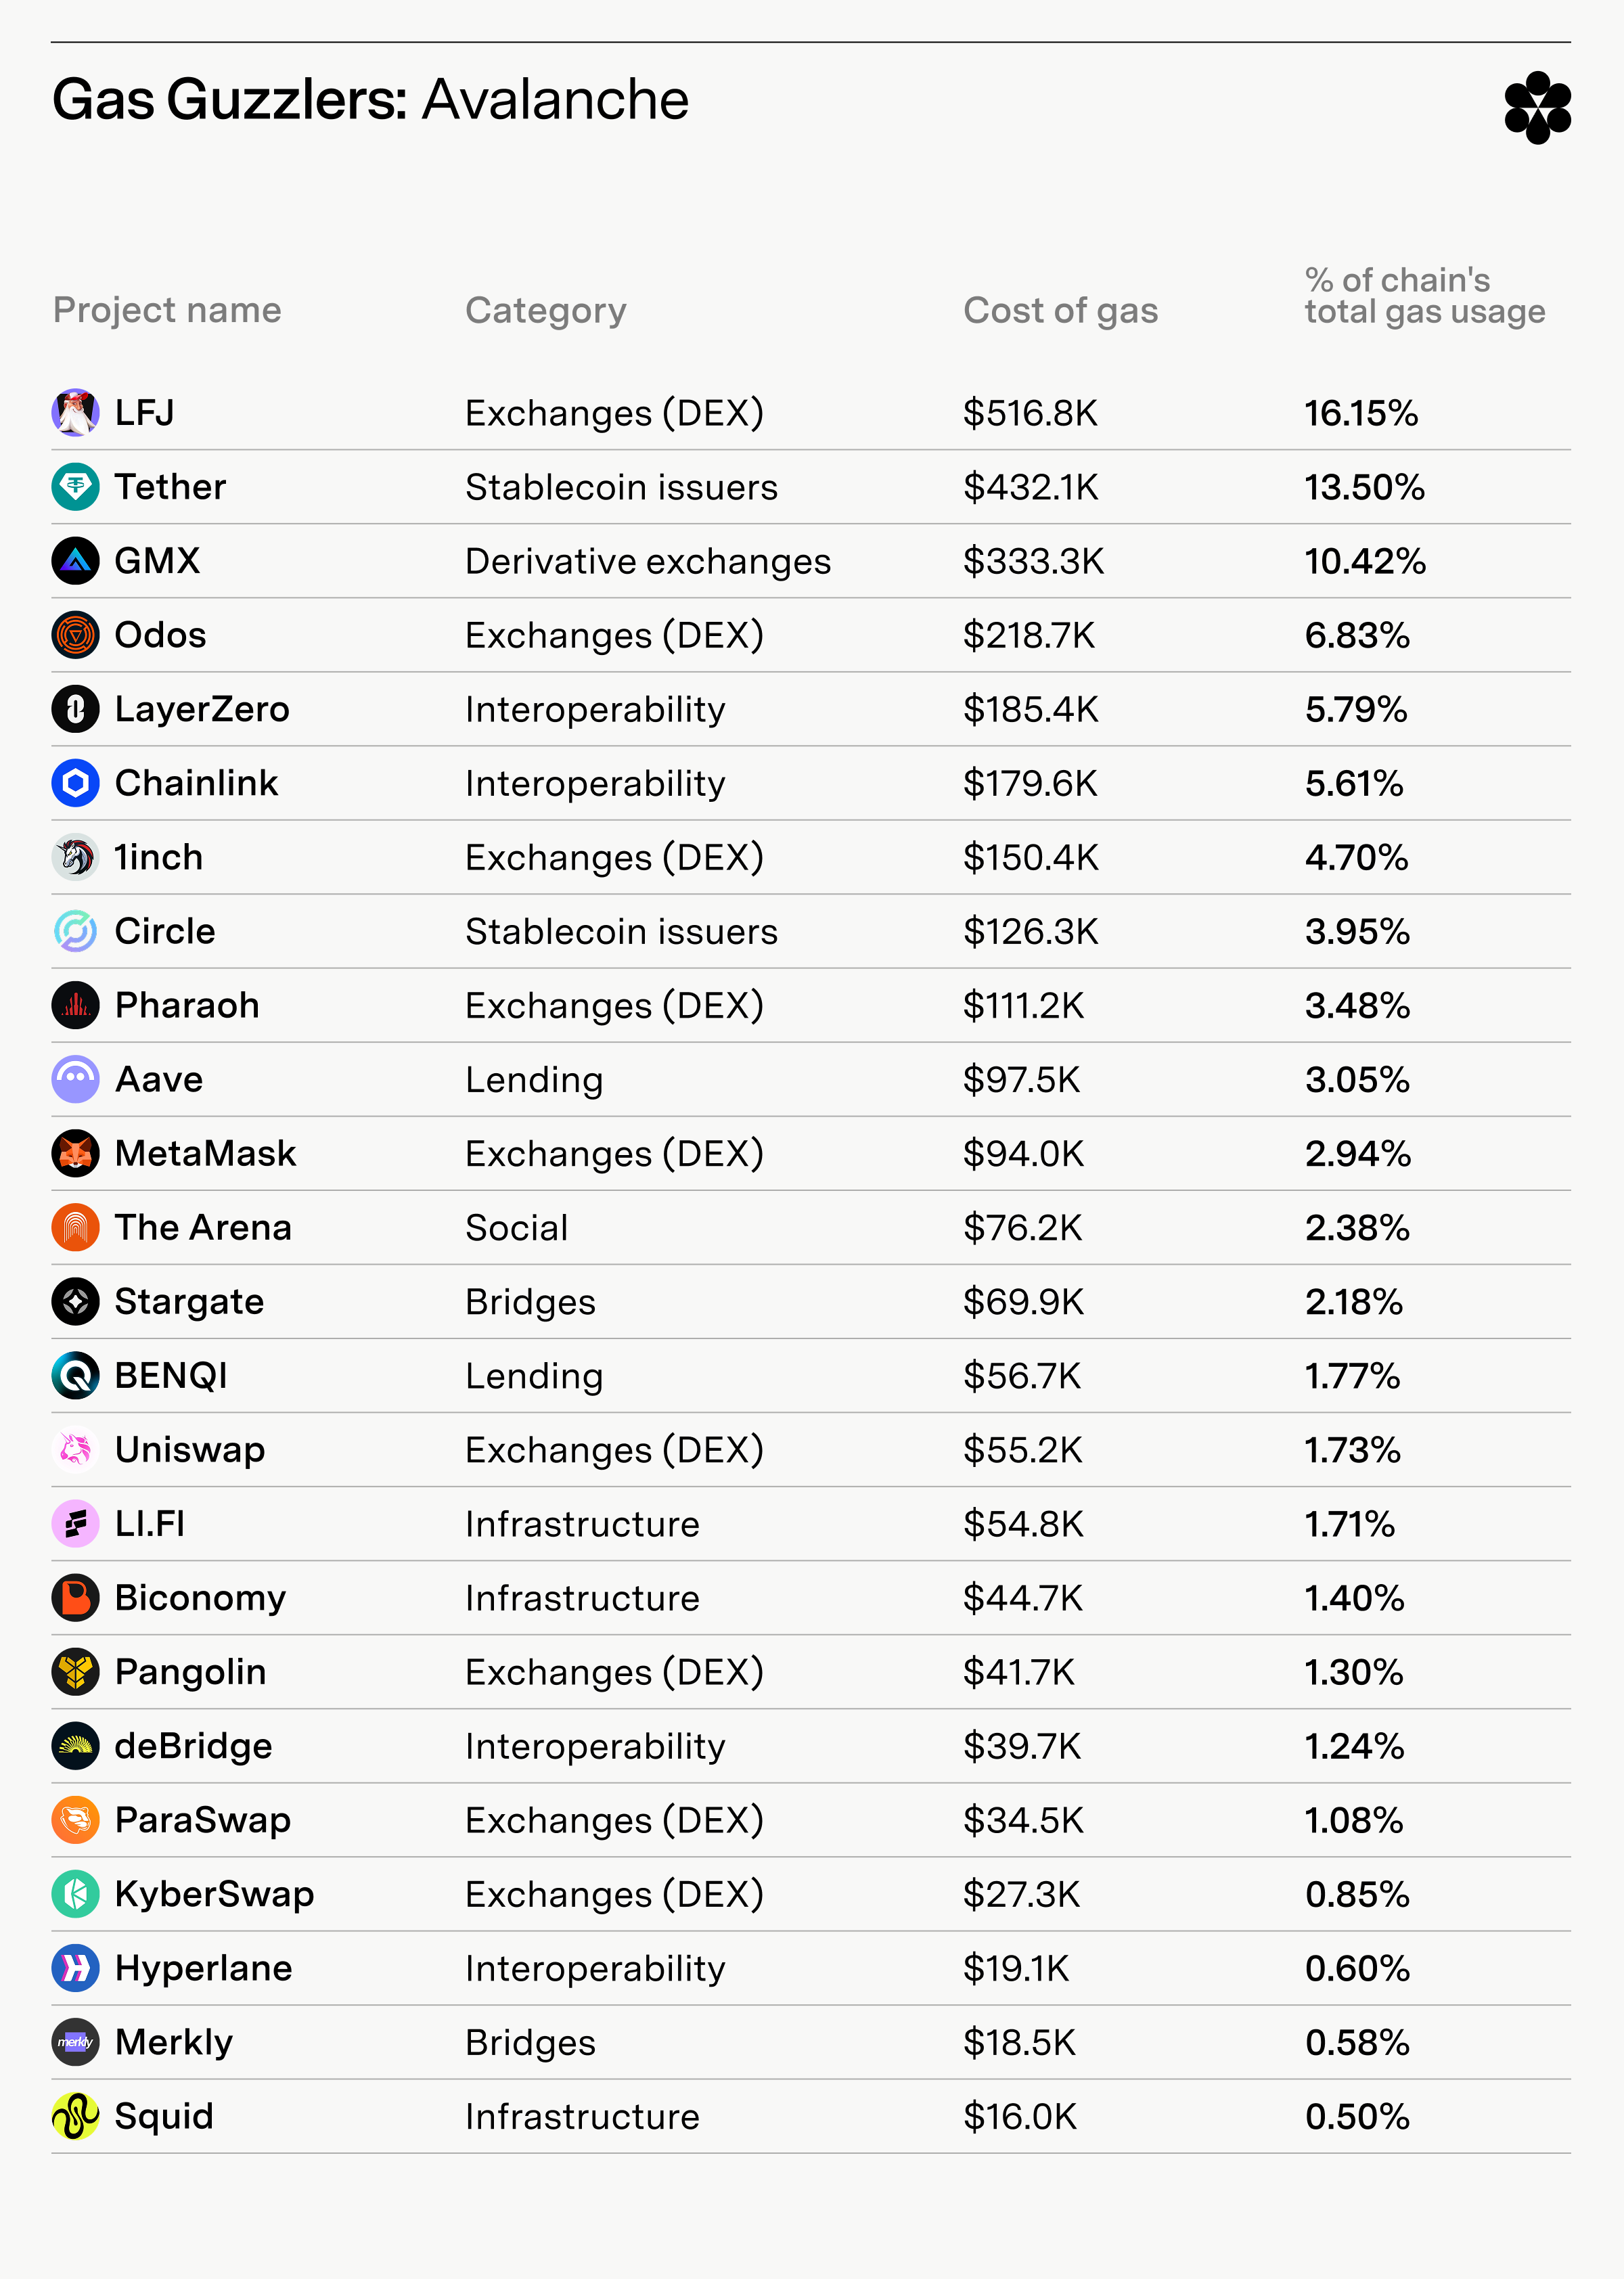
Avalanche’s gas market is widely distributed across many protocols.
LFJ leads with 16.15% of gas usage, followed by Tether (13.50%) and GMX (10.42%).
Notable DeFi protocols focused primarily on Avalanche stand out, such as Pharaoh, BENQUI, and Pangolin, in addition to LFJ.
Onchain social platform The Arena is a notable non-finance protocol spending significantly on Avalanche gas.
Avalanche’s gas usage patterns speak to the strength of its homegrown DeFi ecosystem.
Polygon
Project name
Project category
Cost of gas consumed
Percent of chain's total gas usage
Biconomy
Infrastructure
$261.9K
14.55%
Chainlink
Interoperability
$227.1K
12.62%
Tether
Stablecoin issuers
$198.6K
11.03%
Polymarket
Prediction markets
$148.6K
8.26%
QuickSwap
Exchanges (DEX)
$137.1K
7.62%
Lens Protocol
Social
$125.2K
6.96%
Uniswap
Exchanges (DEX)
$119.6K
6.64%
Planet IX
Gaming
$97.1K
5.39%
Galxe
Infrastructure
$84.8K
4.71%
Circle
Stablecoin issuers
$60.0K
3.33%
ParaSwap
Exchanges (DEX)
$36.2K
2.01%
Aave
Lending
$34.3K
1.91%
Layer3
Infrastructure
$31.4K
1.74%
MetaMask
Exchanges (DEX)
$28.1K
1.56%
0x
Exchanges (DEX)
$21.5K
1.19%
LI.FI
Infrastructure
$19.3K
1.07%
Sky
Stablecoin issuers
$18.8K
1.04%
1inch
Exchanges (DEX)
$18.8K
1.04%
LayerZero
Interoperability
$17.1K
0.95%
KGen
Gaming
$16.9K
0.94%
MOOAR
NFT marketplaces
$15.0K
0.83%
Odos
Exchanges (DEX)
$13.3K
0.74%
KyberSwap
Exchanges (DEX)
$11.1K
0.62%
deBridge
Interoperability
$10.4K
0.58%
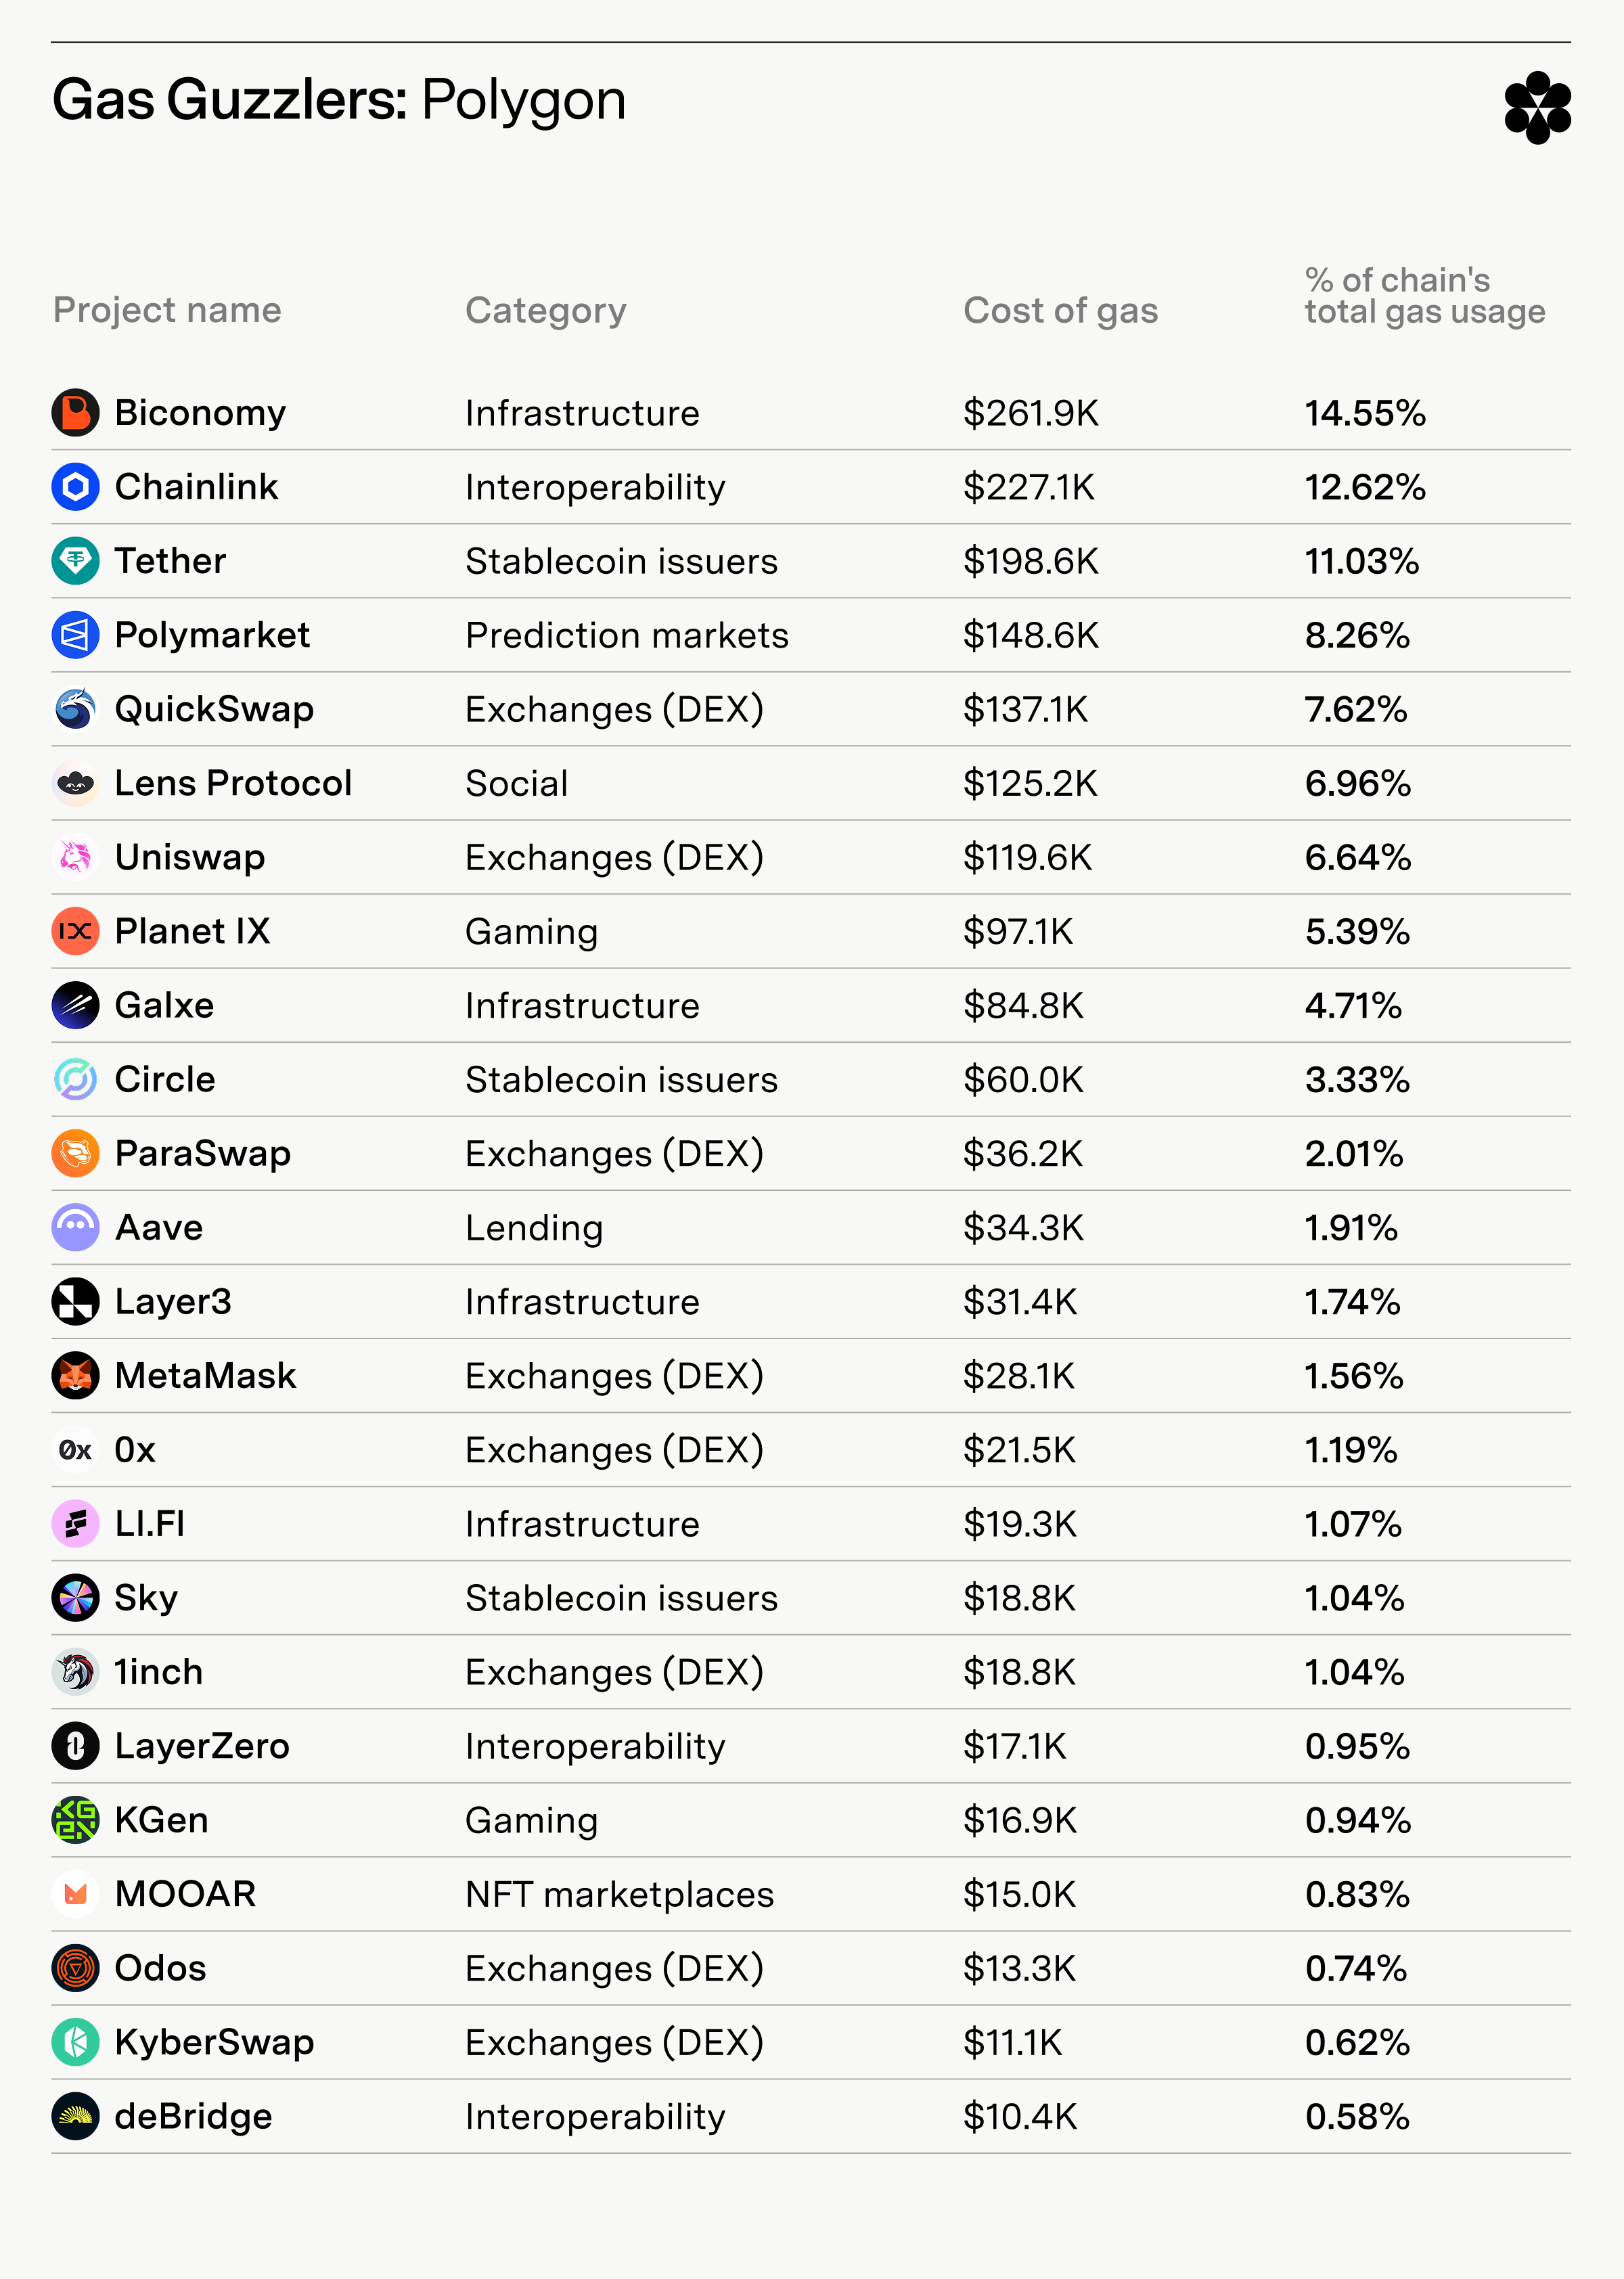
Polygon’s gas market distribution is even more balanced than Avalanche’s.
Account abstraction provider Biconomy leads with 14.55% of gas spending, followed by Chainlink (12.62%) and Tether (11.03%).
Leading prediction market Polymarket is a close fourth in gas spending at 8.26%.
PlanetIX stands out as a high-spending onchain game.
Polygon has the most evenly distributed gas spending of any chain we analyze – no single protocol dominates.
TON
Project name
Project category
Cost of gas consumed
Percent of chain's total gas usage
STON.fi
Exchanges (DEX)
$2.1M
91.30%
DeDust
Exchanges (DEX)
$144.8K
6.30%
UXUY
Exchanges (DEX)
$4.8K
0.21%
Getgems
NFT marketplaces
$4.1K
0.18%
Layerswap
Bridges
$88.10
0.01%
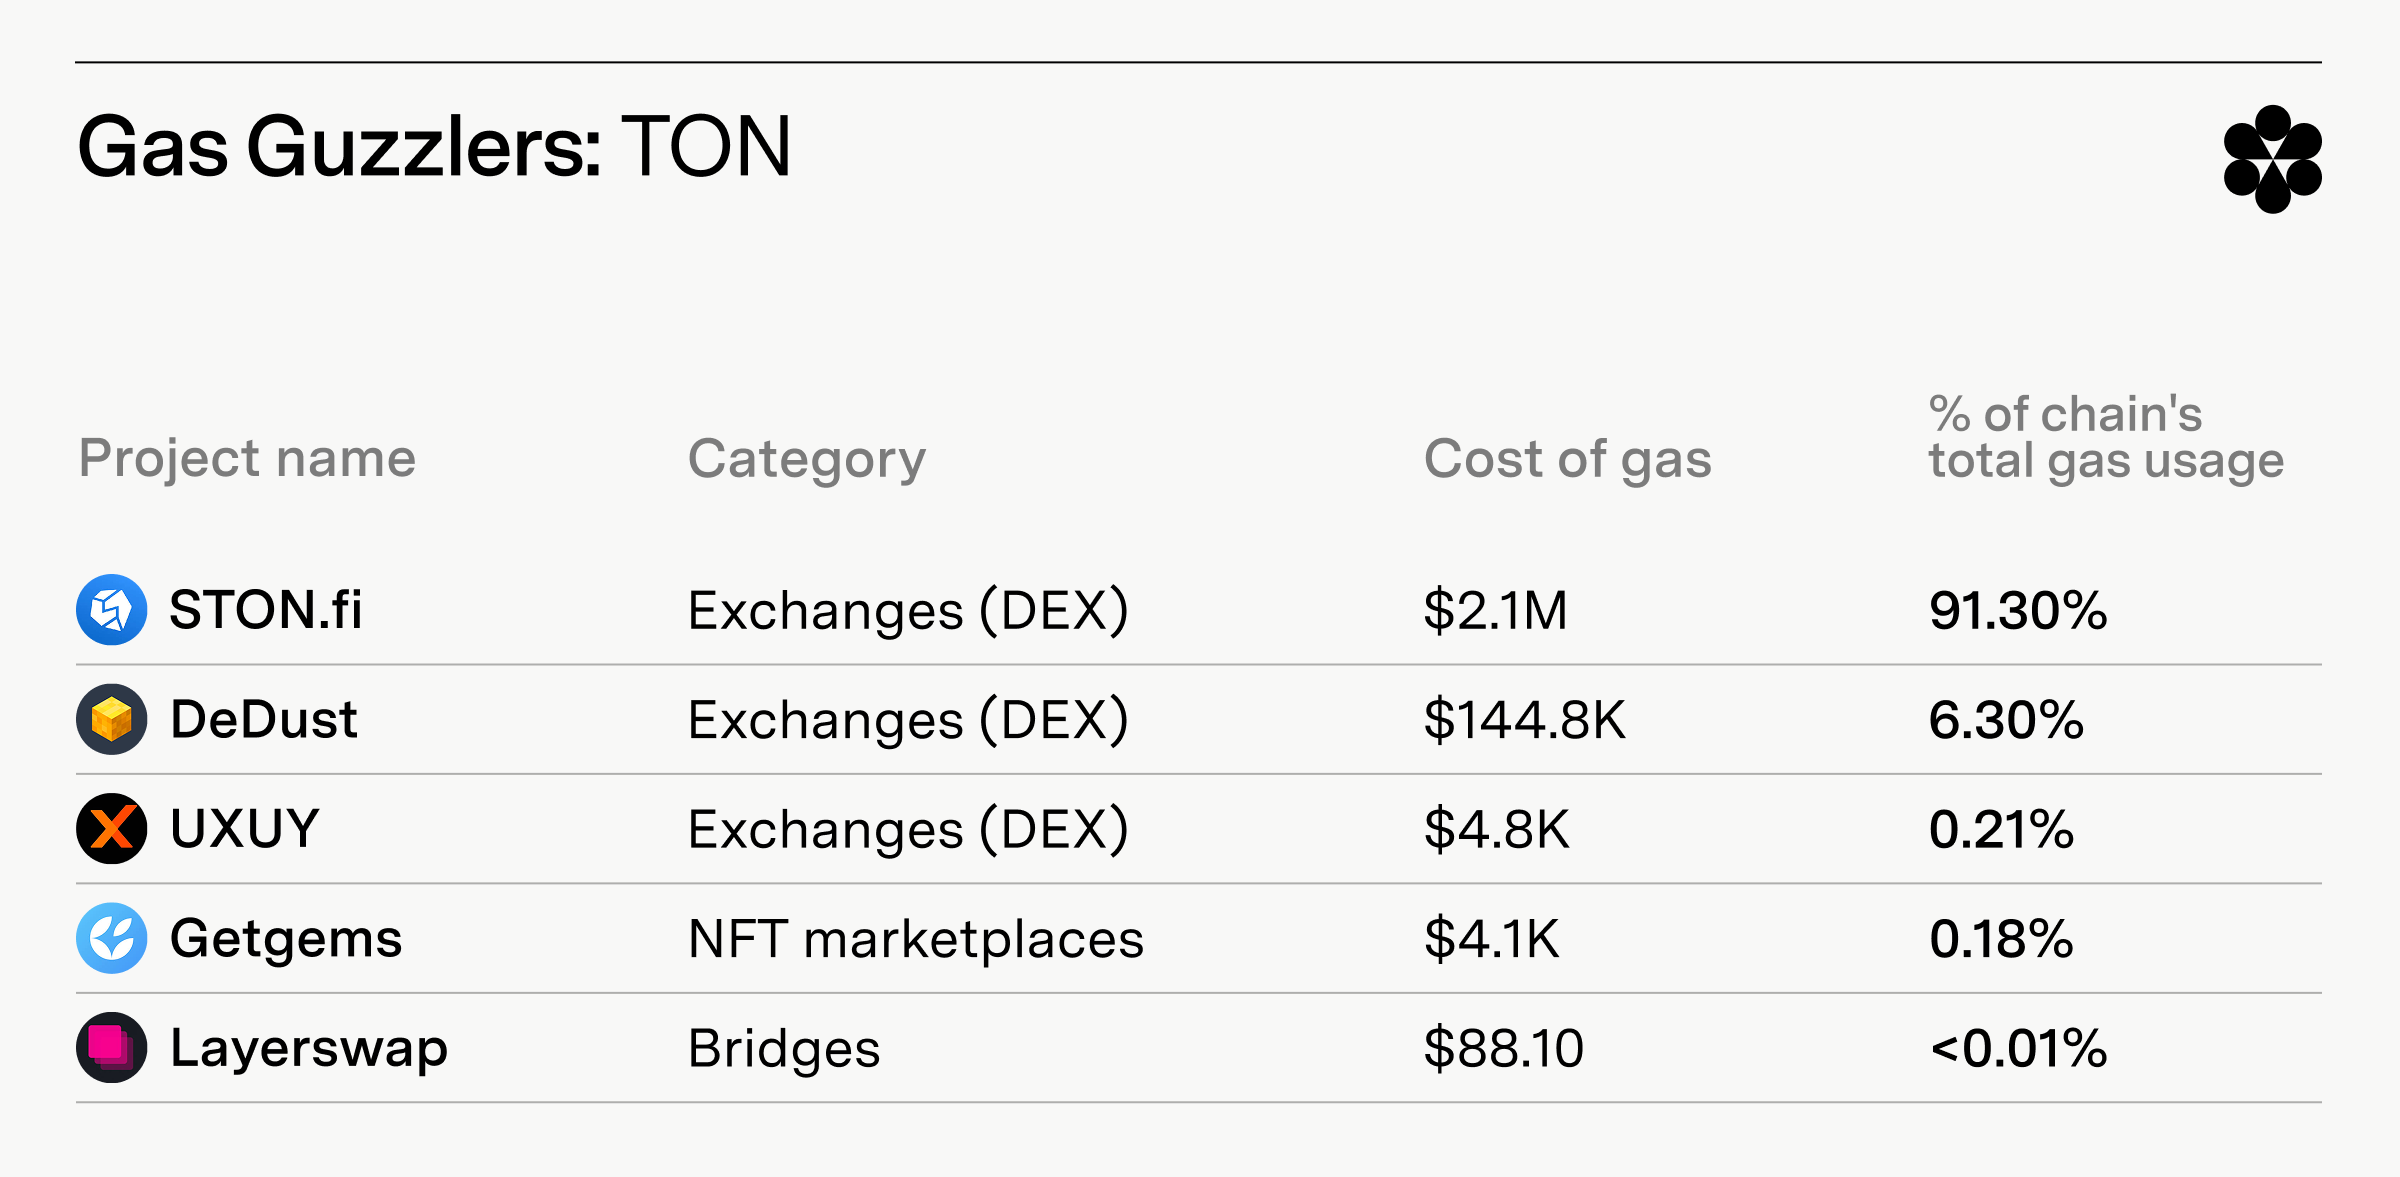
Telegram’s TON blockchain has the second-highest level of gas spending concentration among all chains we analyze.
StonFi leads with a whopping 91.30% of TON gas usage, followed by DeDust (6.30%) and UXUY (0.21%).
All three leading protocols are DEXs.
Only one infrastructure provider, Layerswap, is spending significantly on gas.
The data suggests that TON is catering primarily to traders.
NEAR Protocol
Project name
Project category
Cost of gas consumed
Percent of chain's total gas usage
HOT Protocol
Infrastructure
$3.0M
48.39%
KAI-CHING
Gaming
$2.1M
33.87%
Sweatcoin
Social
$826.0K
13.32%
Meteor Wallet
Infrastructure
$145.2K
2.34%
PlayEmber
Gaming
$80.1K
1.29%
Tether
Stablecoin issuers
$19.0K
0.31%
Pyth Network
Oracles
$17.4K
0.28%
Circle
Stablecoin issuers
$15.0K
0.24%
Nearlend DAO
Lending
$13.9K
0.22%
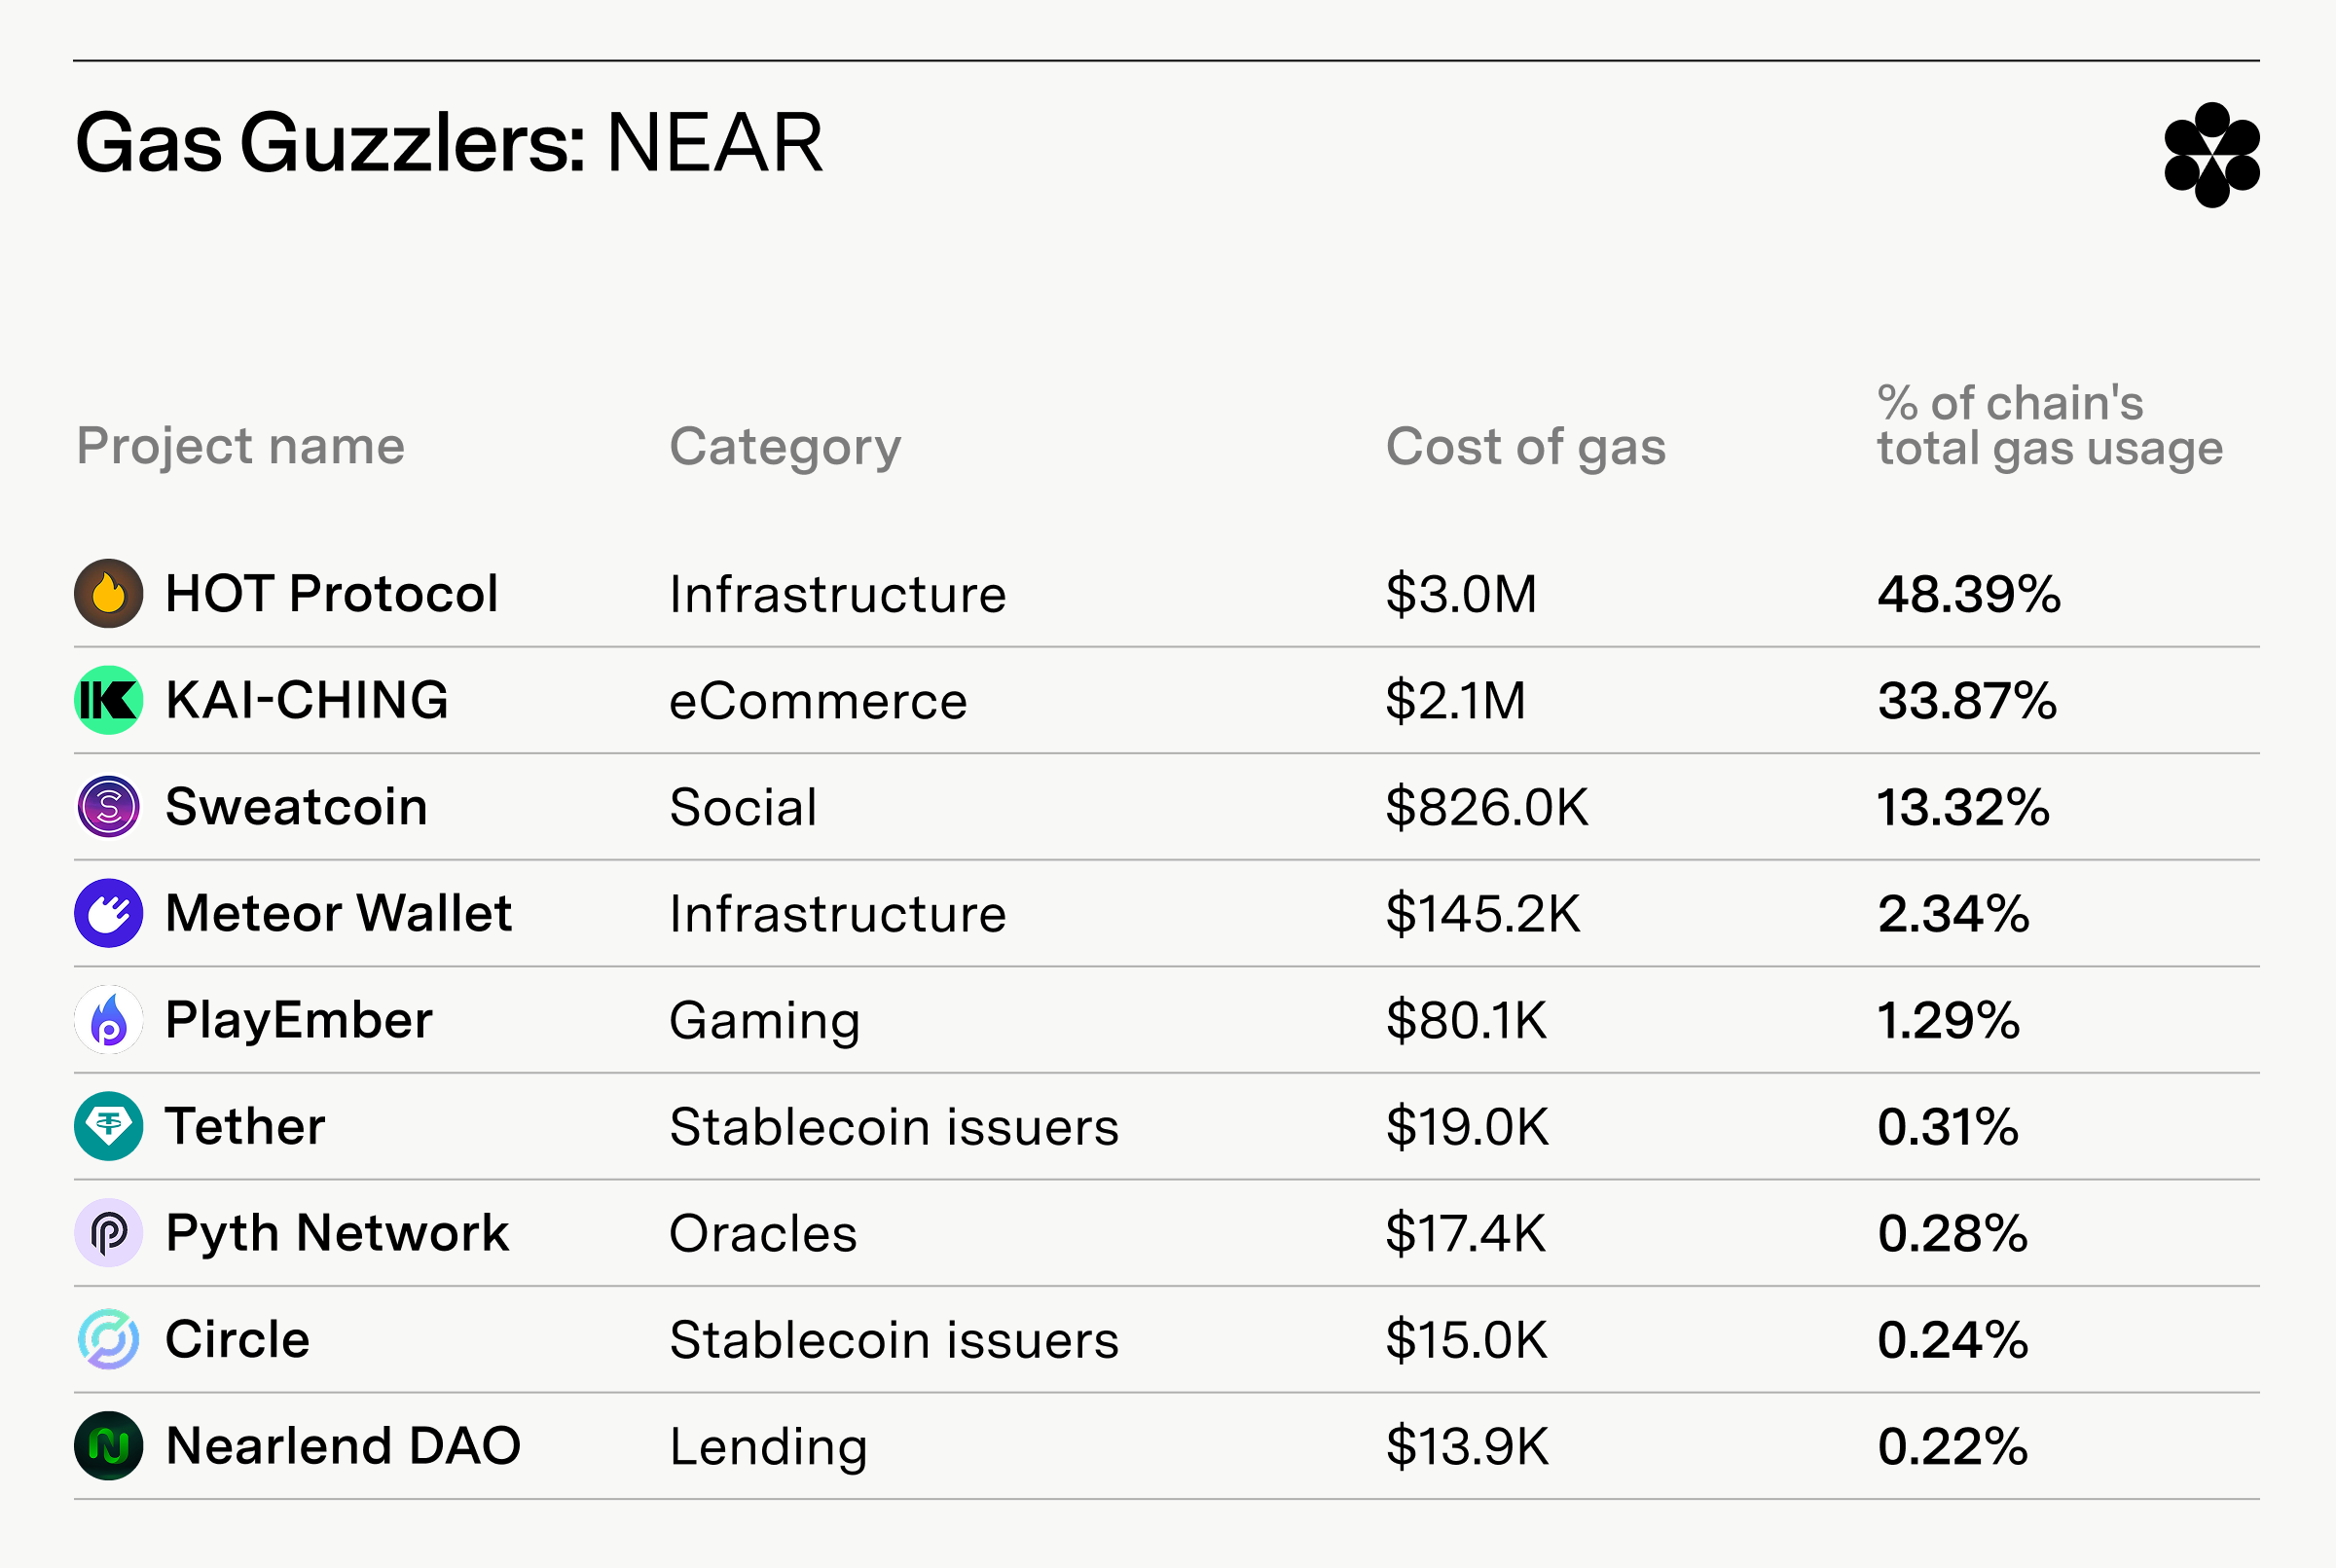
NEAR’s focus on consumer apps stands out in its gas market distribution.
Wallet provider HOT Protocol leads at 48.39% of gas usage, followed by Cosmose AI’s e-commerce rewards protcol KAI-CHING (33.87%) and step-to-earn protocol Sweatcoin (13.32%).
Onchain game PlayEmber is another consumer-focused app spending lots on NEAR gas.
Ronin Network
Project name
Project category
Cost of gas consumed
Percent of chain's total gas usage
Pixels
Gaming
$492.2K
49.89%
Axie Infinity
Gaming
$225.4K
22.85%
Carv
Infrastructure
$164.4K
16.66%
Wild Forest
Gaming
$54.9K
5.56%
Pyth Network
Oracles
$24.3K
2.46%
Fableborne
Gaming
$10.5K
1.06%
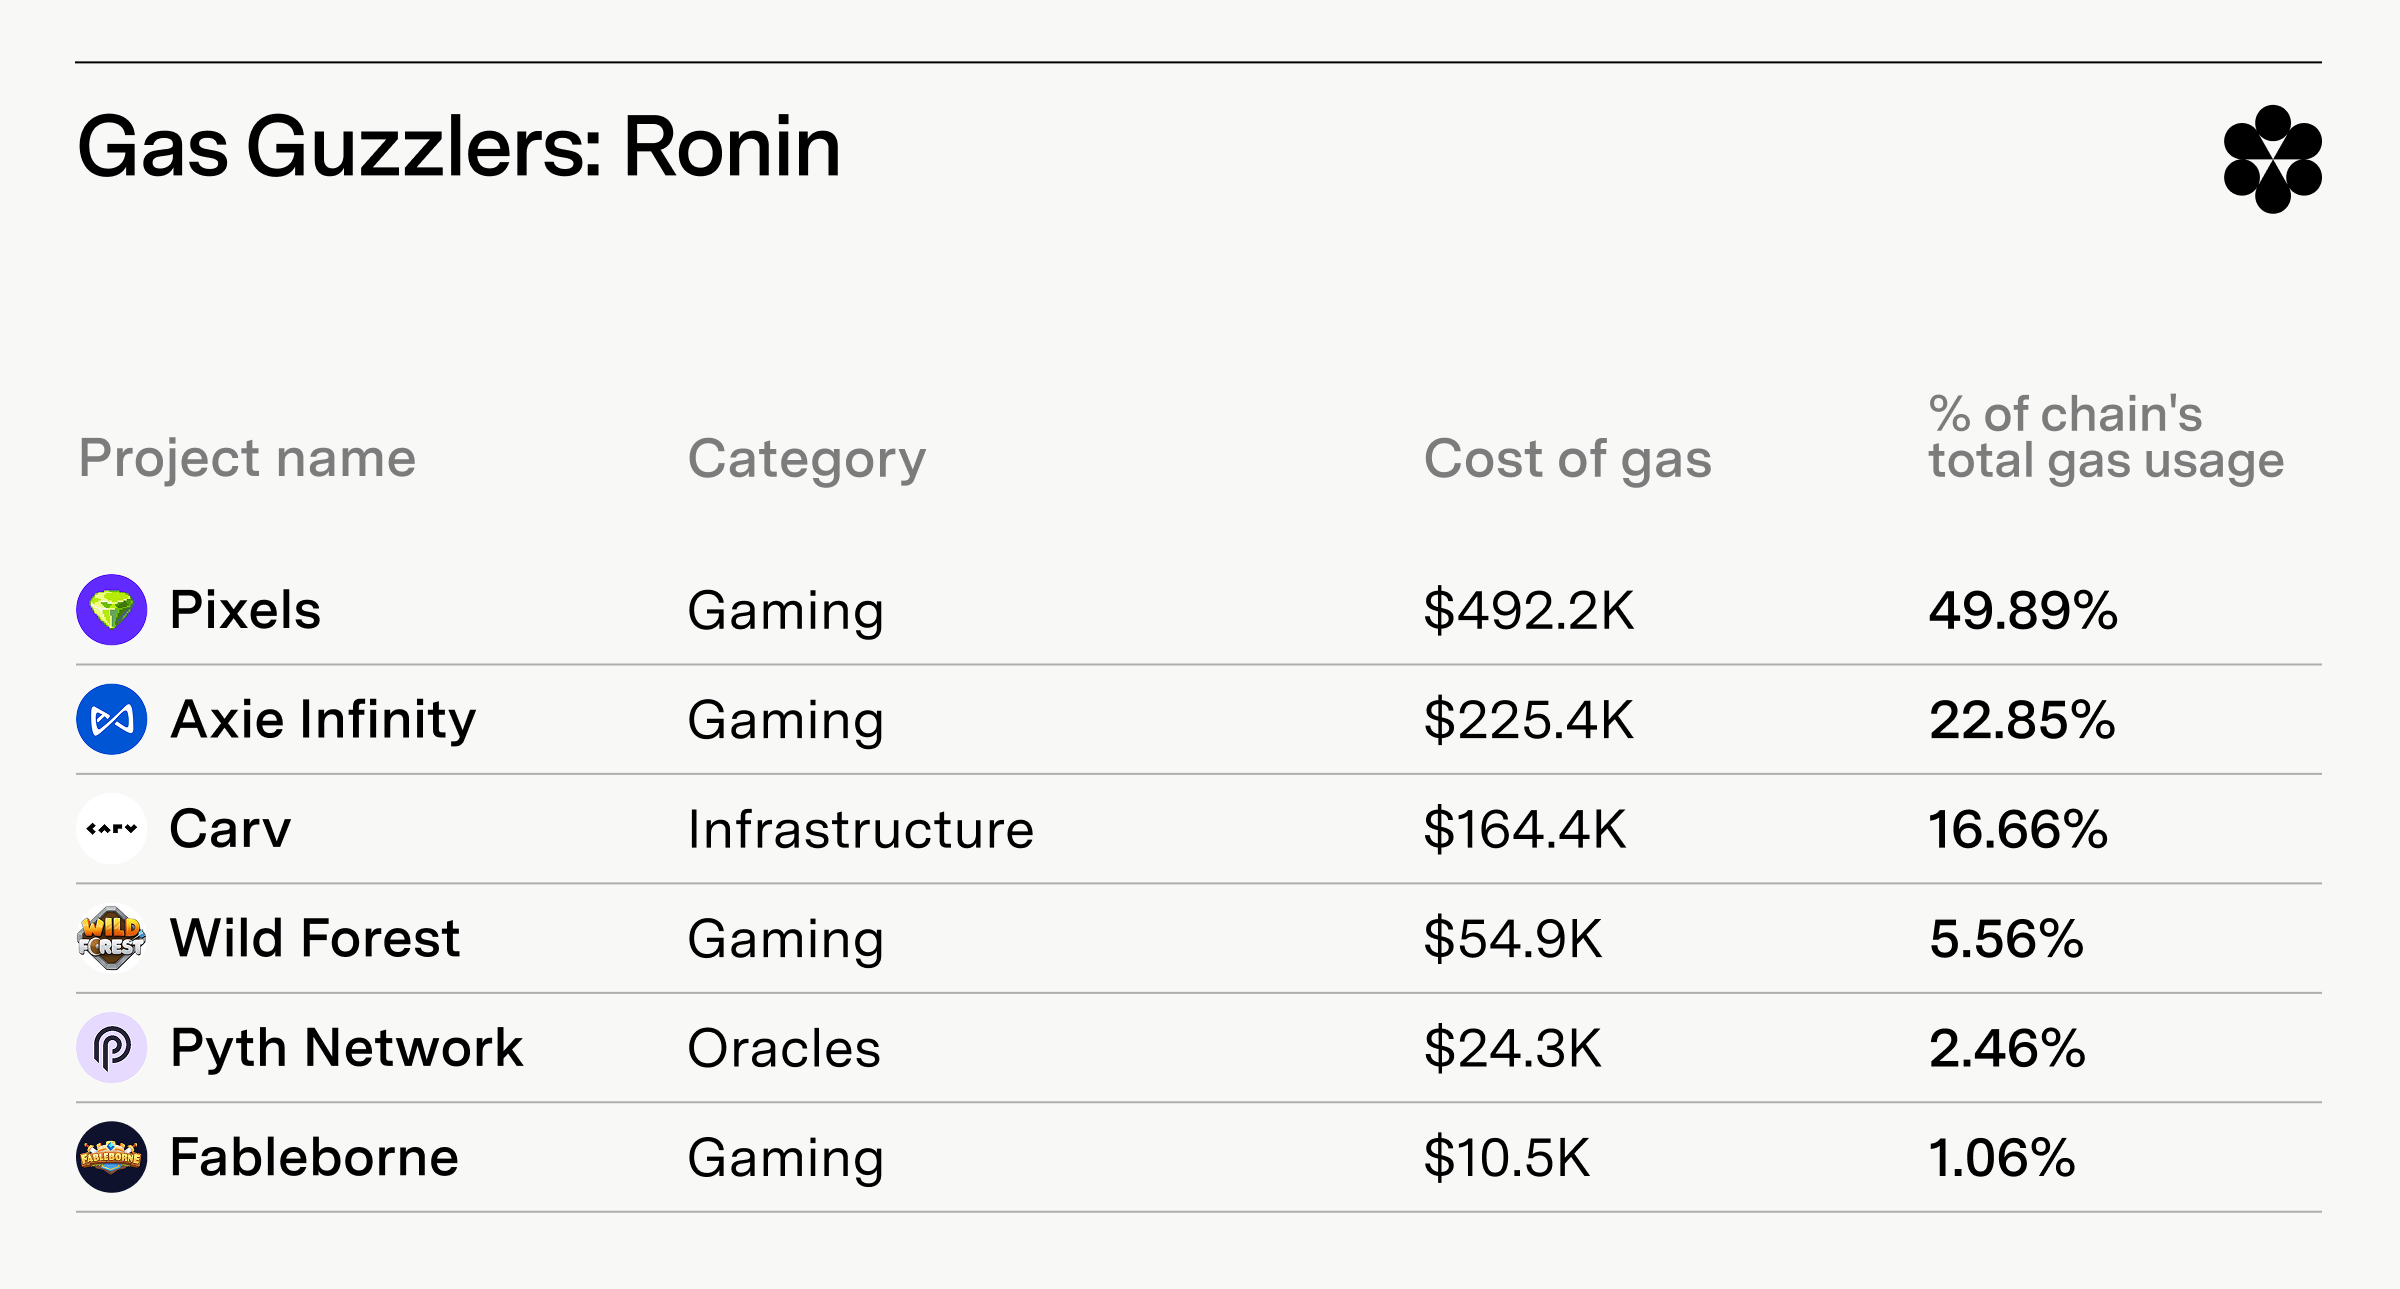
Ronin Network is purpose-built for gaming, with three games in particular dominating gas spending over the last year:
Pixels is Ronin’s top gas guzzler at 49.89% of total usage, spending nearly $500,000 on gas over the last year. We previously discussed Pixels’ gas usage on Ronin in our analysis of onchain gaming costs.
Onchaing gaming mainstay Axie Infinity is next at 22.85% of total Ronin gas spending, followed by Carv (16.66%).
Immutable zkEVM
Project name
Project category
Cost of gas consumed
Percent of chain's total gas usage
BoomLand
Gaming
$32.7K
57.37%
Baby Shark Universe
Gaming
$20.8K
36.49%
Overtake
Gaming
$2.1K
3.68%
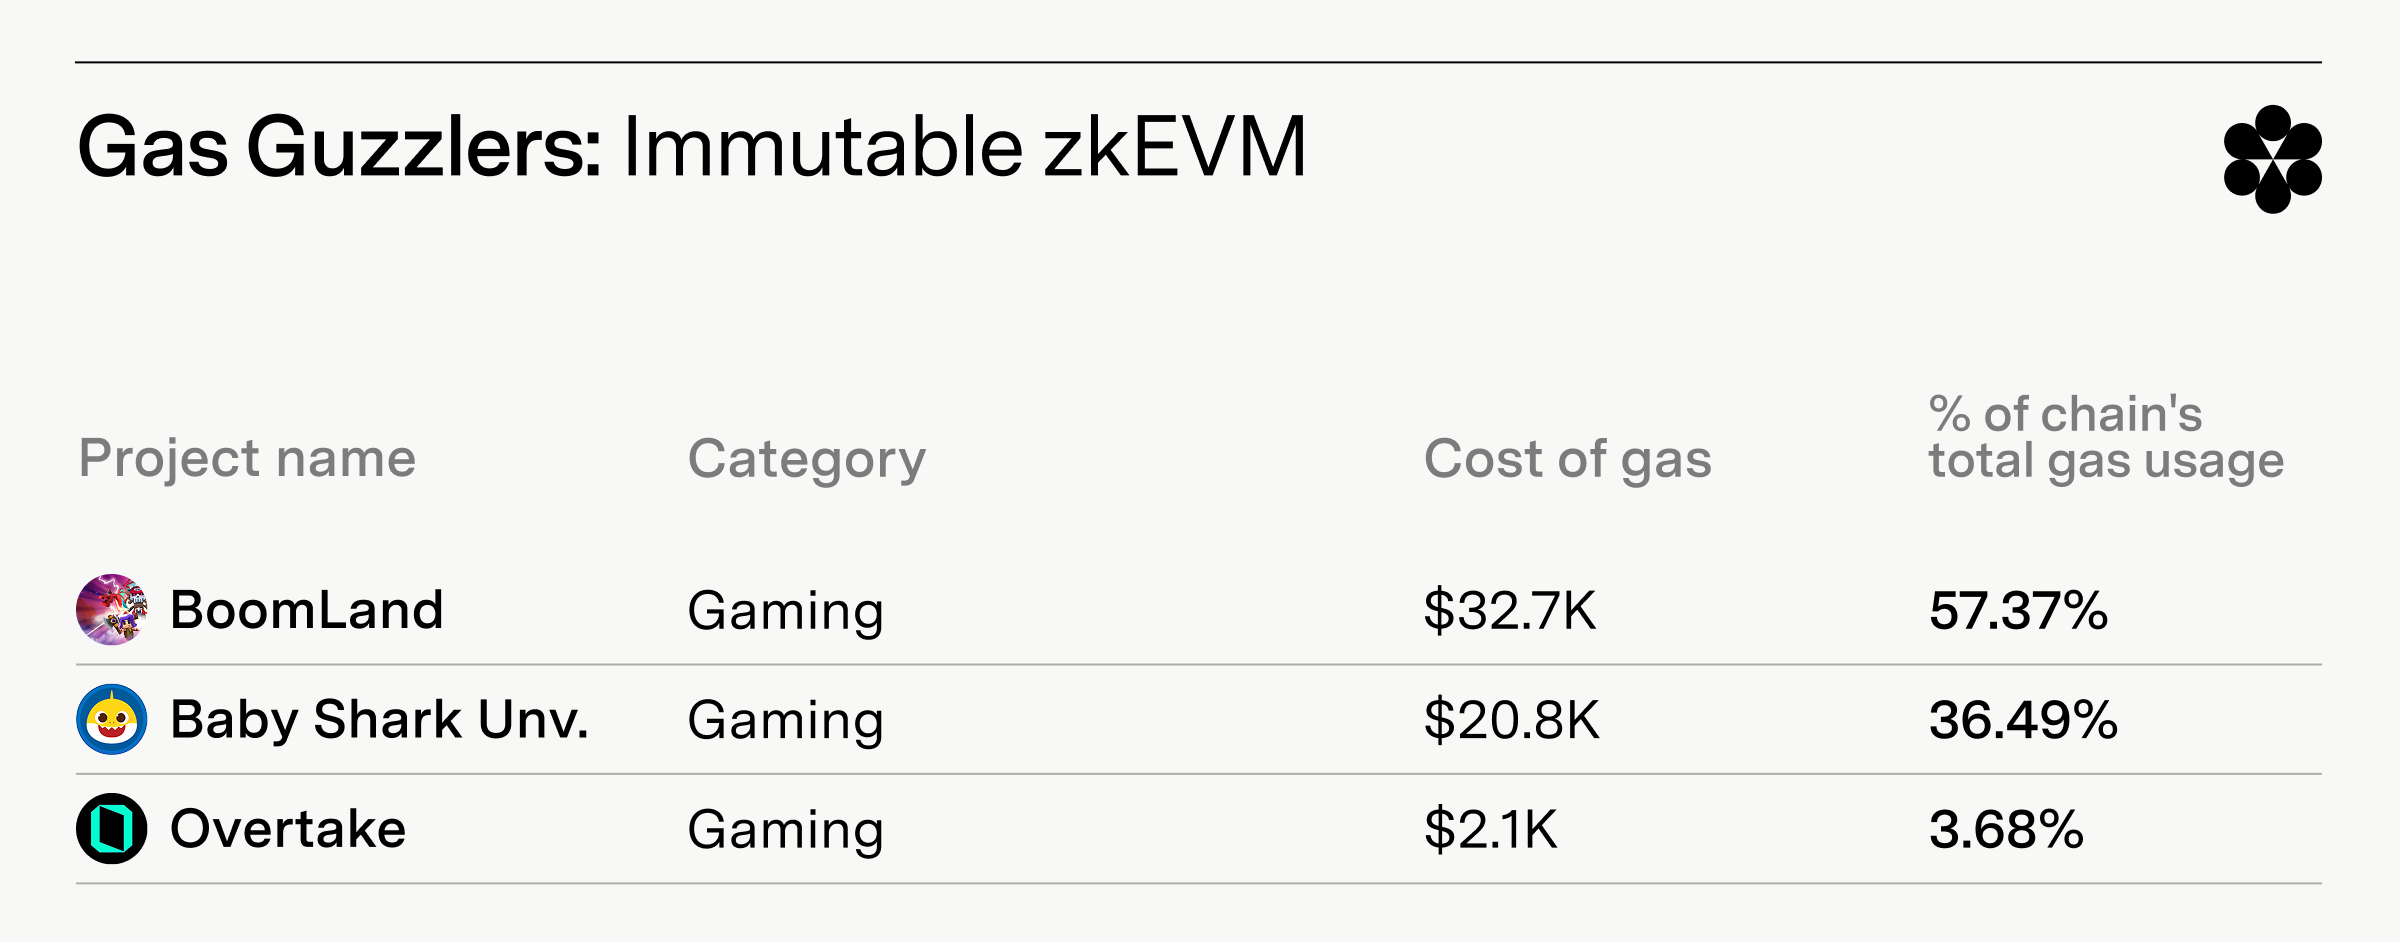
Like Ronin, Immutable zkEVM is also built to accommodate onchain gaming.
BoomLand is the leading gas spender on the chain at 57.37% of gas usage over the last year. BoomLand is a studio with several games in production, including the popular Hunters On-Chain.
Adventure game Baby Shark Universe is next with 36.49% of Immutable zkEVM gas usage.
Gaming infrastructure provider Overtake is third with 3.68% of gas usage on the chain.
Salute to the gas guzzlers
Understanding which protocols drive gas consumption and why is essential to both onchain app developers and blockchain operators. Gas market analysis reveals which protocols deliver real value and guide future development priorities, while also highlighting each blockchain’s unique strengths. We commend these protocols for the value they deliver to users, and are eager to see how these patterns change over the coming years.
Thank you as well to Token Terminal, whose gas usage tracking made this analysis possible!